Consumption
Households continue to underpin recovery
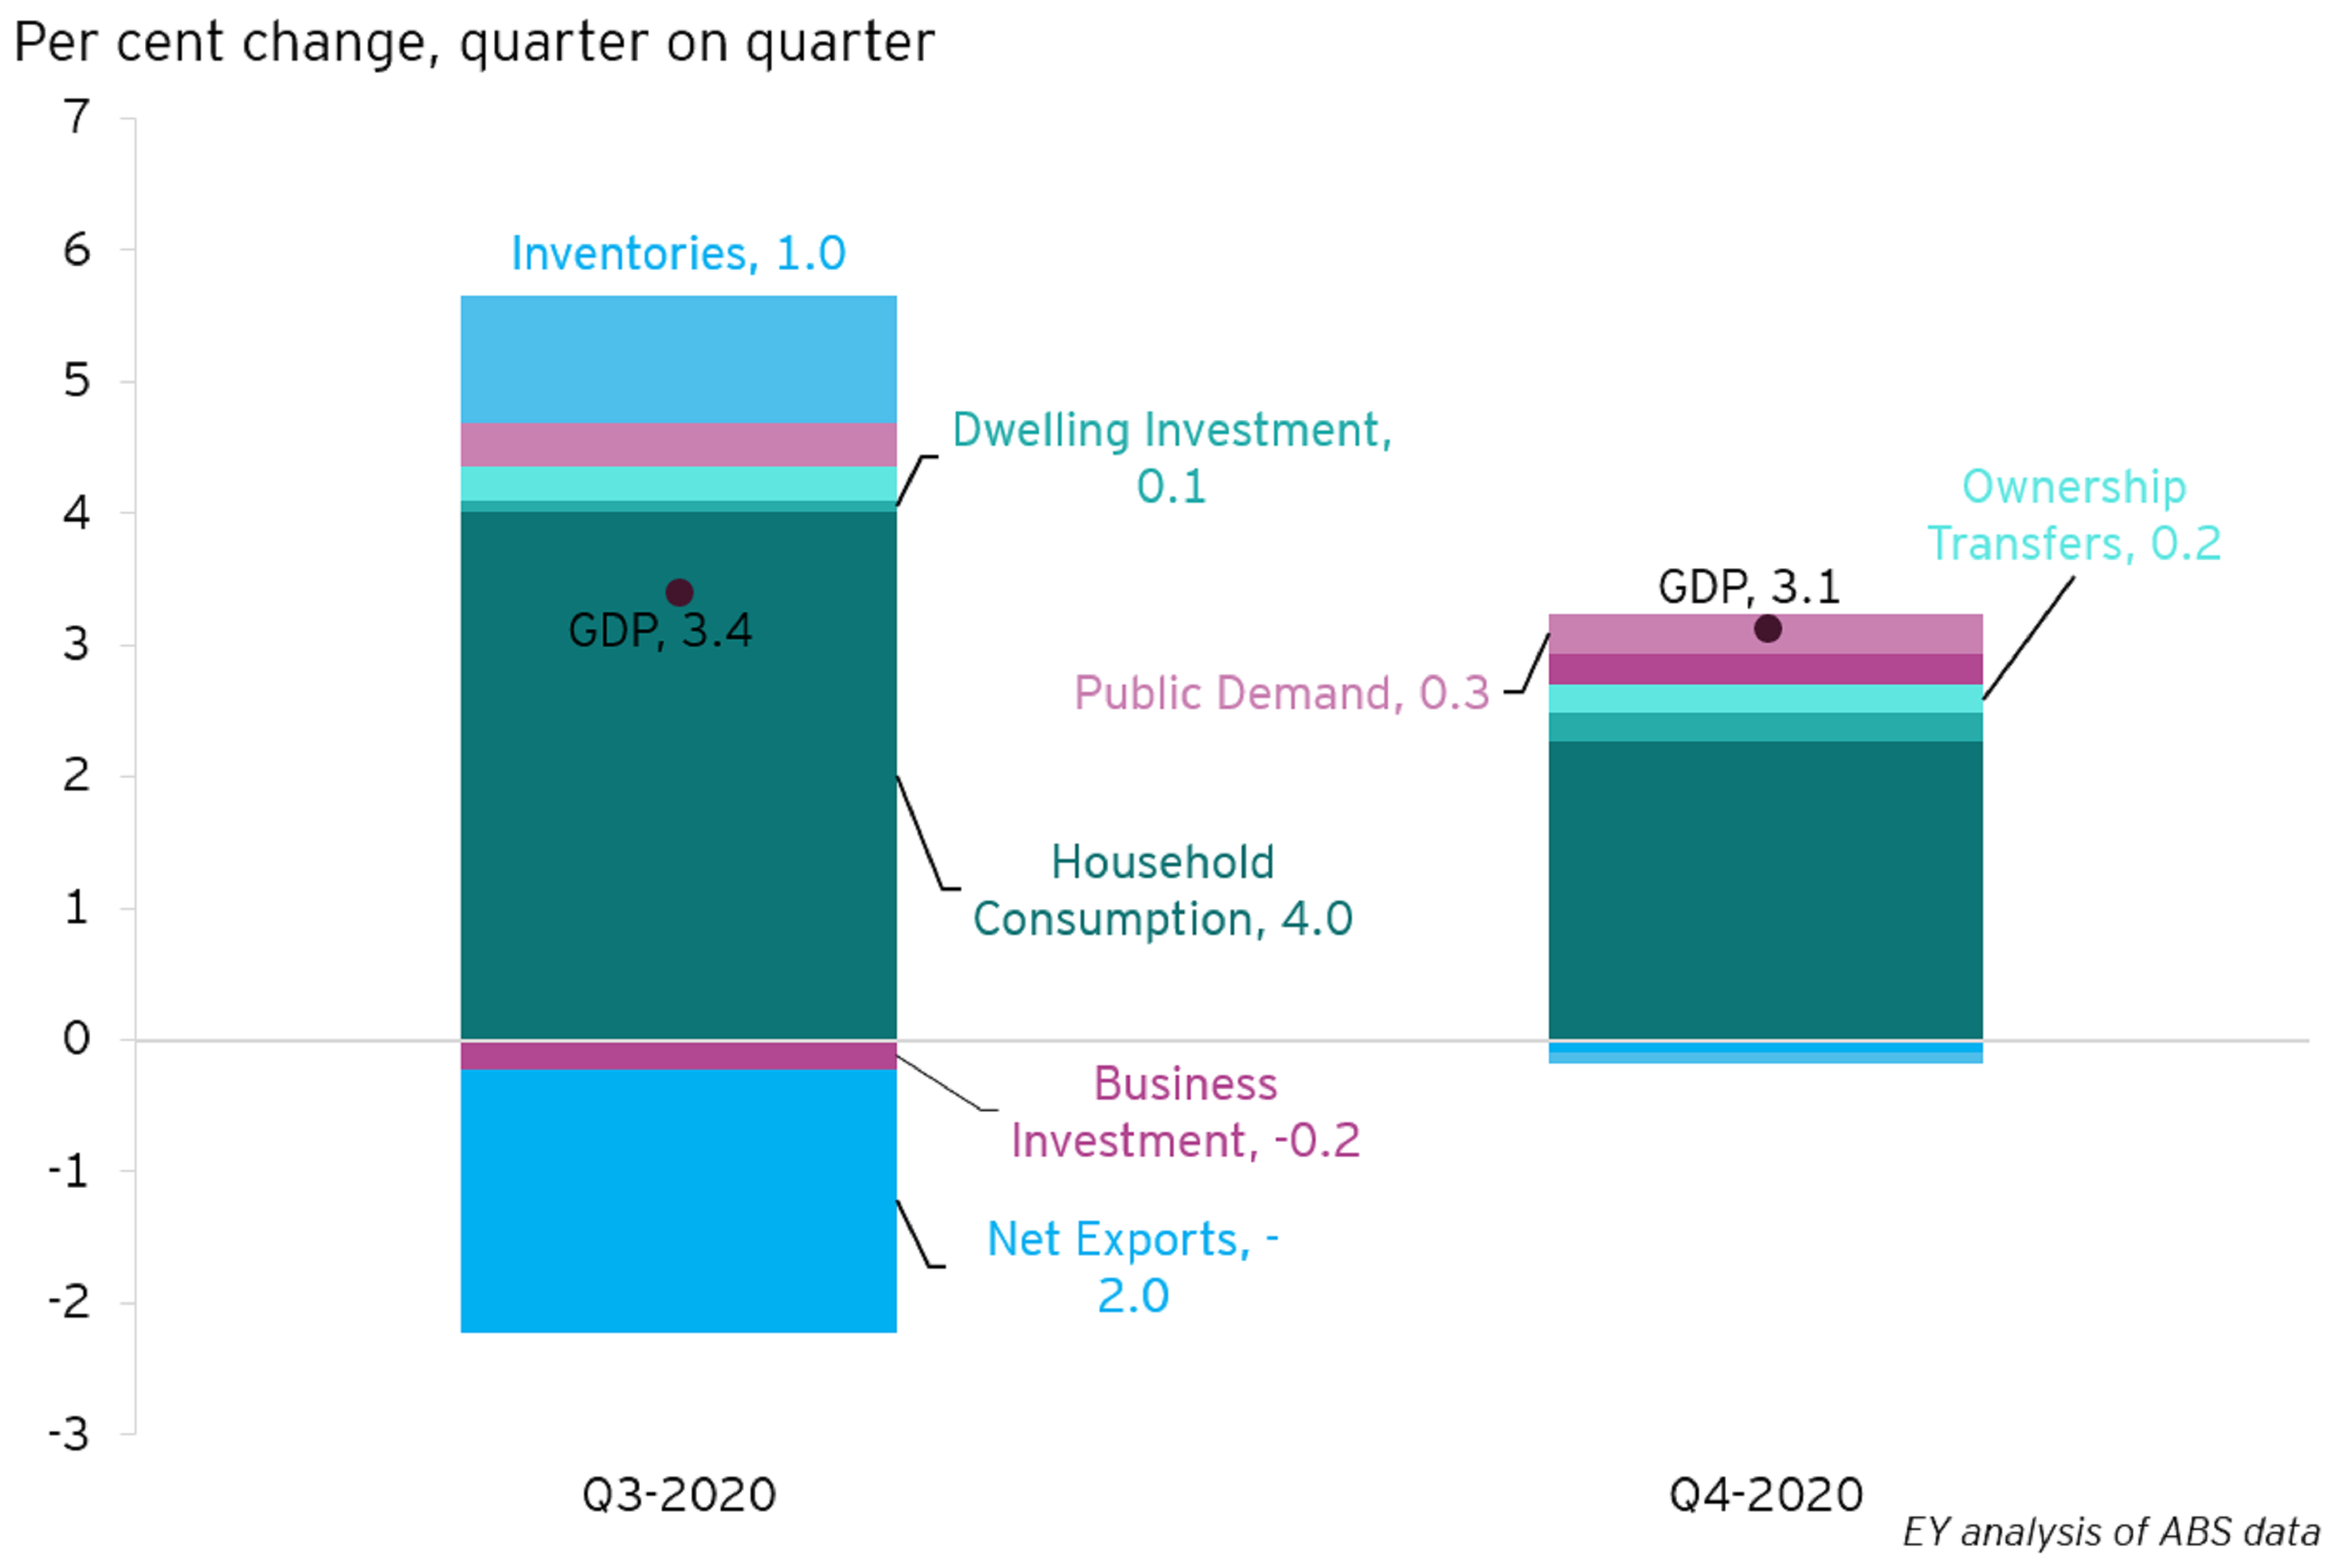
Household consumption rose by 4.3 per cent in the quarter, adding 2.3 percentage points to economic growth.
Households continue to underpin the recovery in economic activity. Household consumption rose by 4.3 per cent in the quarter, adding 2.3 ppt to economic growth or 75 per cent of the growth in GDP during the quarter.
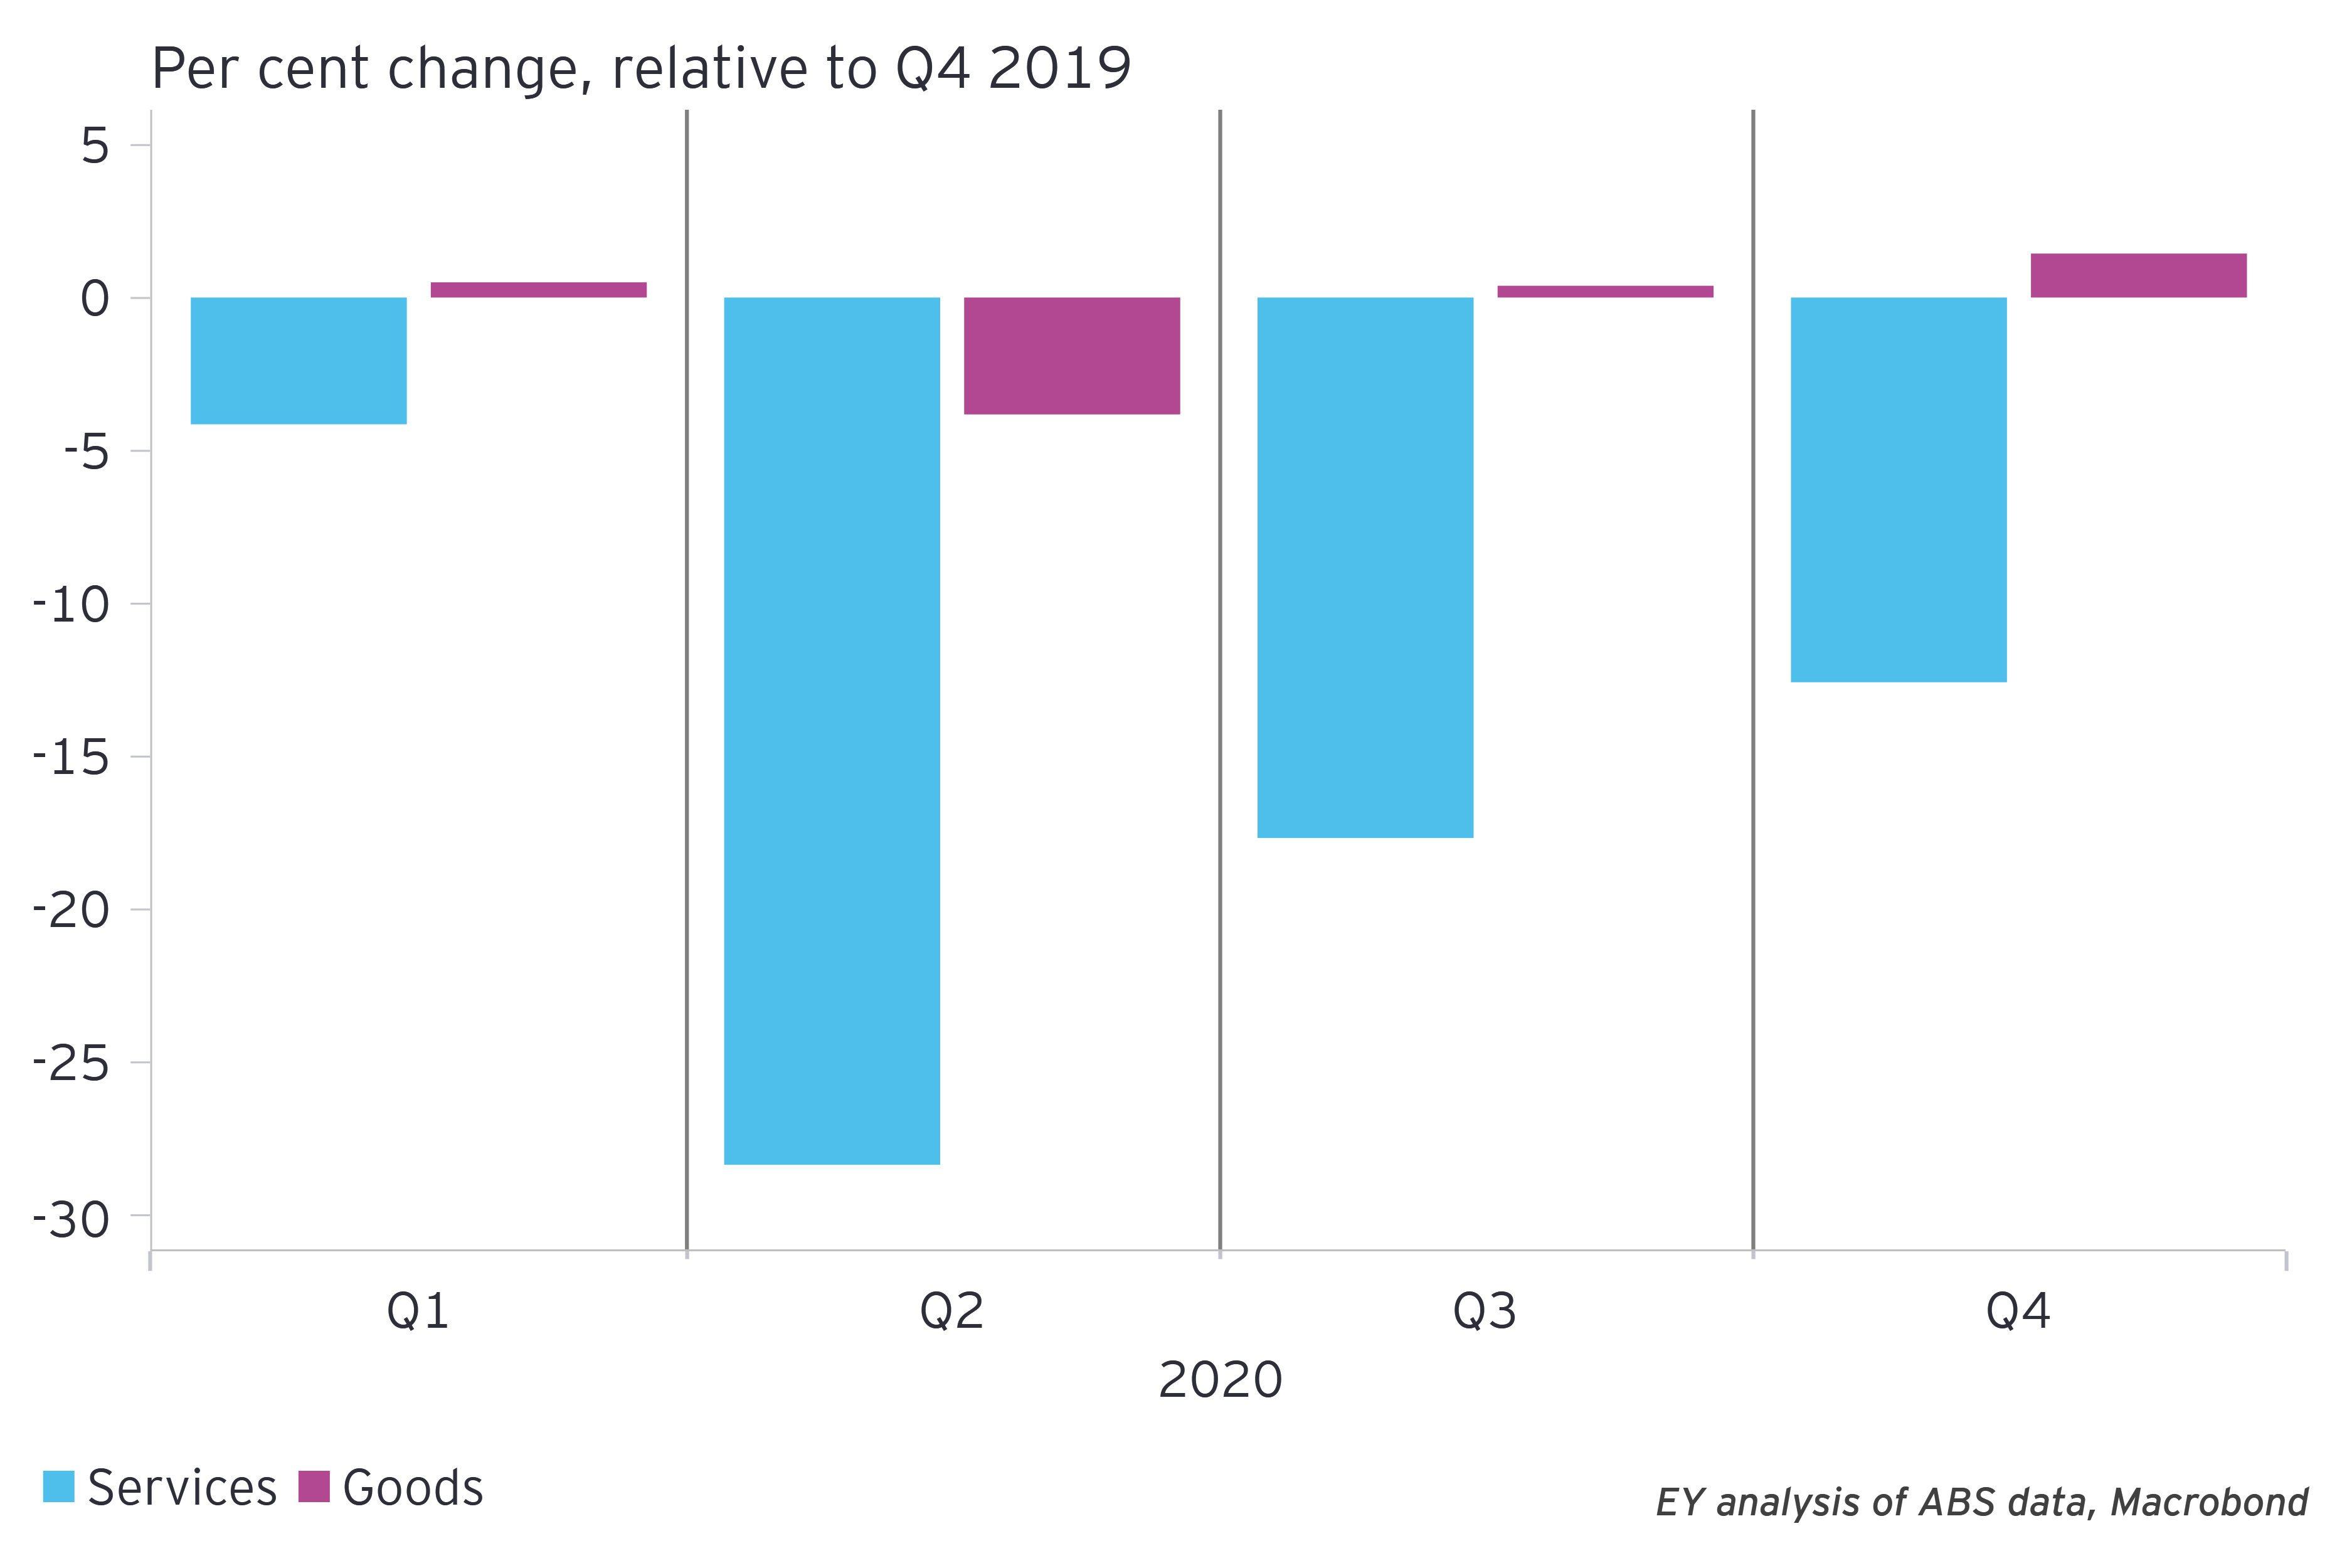
The rise in household spending was driven by a strong recovery in spending on services – as restrictions eased, especially in Victoria - and the purchase of vehicles. The main contributors to the rise were recreation and culture (adding 0.5 ppt), hotel, cafes and restaurants (adding 0.4 ppt), other goods and services (adding 0.4 ppt) and purchases of vehicles (adding 0.3 ppt). The rise in household spending was partially offset by lower spending on food, alcohol, utilities and tobacco – most of which had been elevated due to the increased time spent at home. Households are starting to rebalance spending between goods and services.
The easing of health restrictions in Victoria largely drove the bounce back in household spending, after stage four restrictions during the September quarter hindered consumers ability to get out and spend. Household consumption rose by 10.4 per cent within the state during the quarter, led by increases in recreation and culture, clothing and footwear, other goods and services, hotels, cafes and restaurants, purchase of vehicles, and health.
Households start to rebalance spending between goods and services
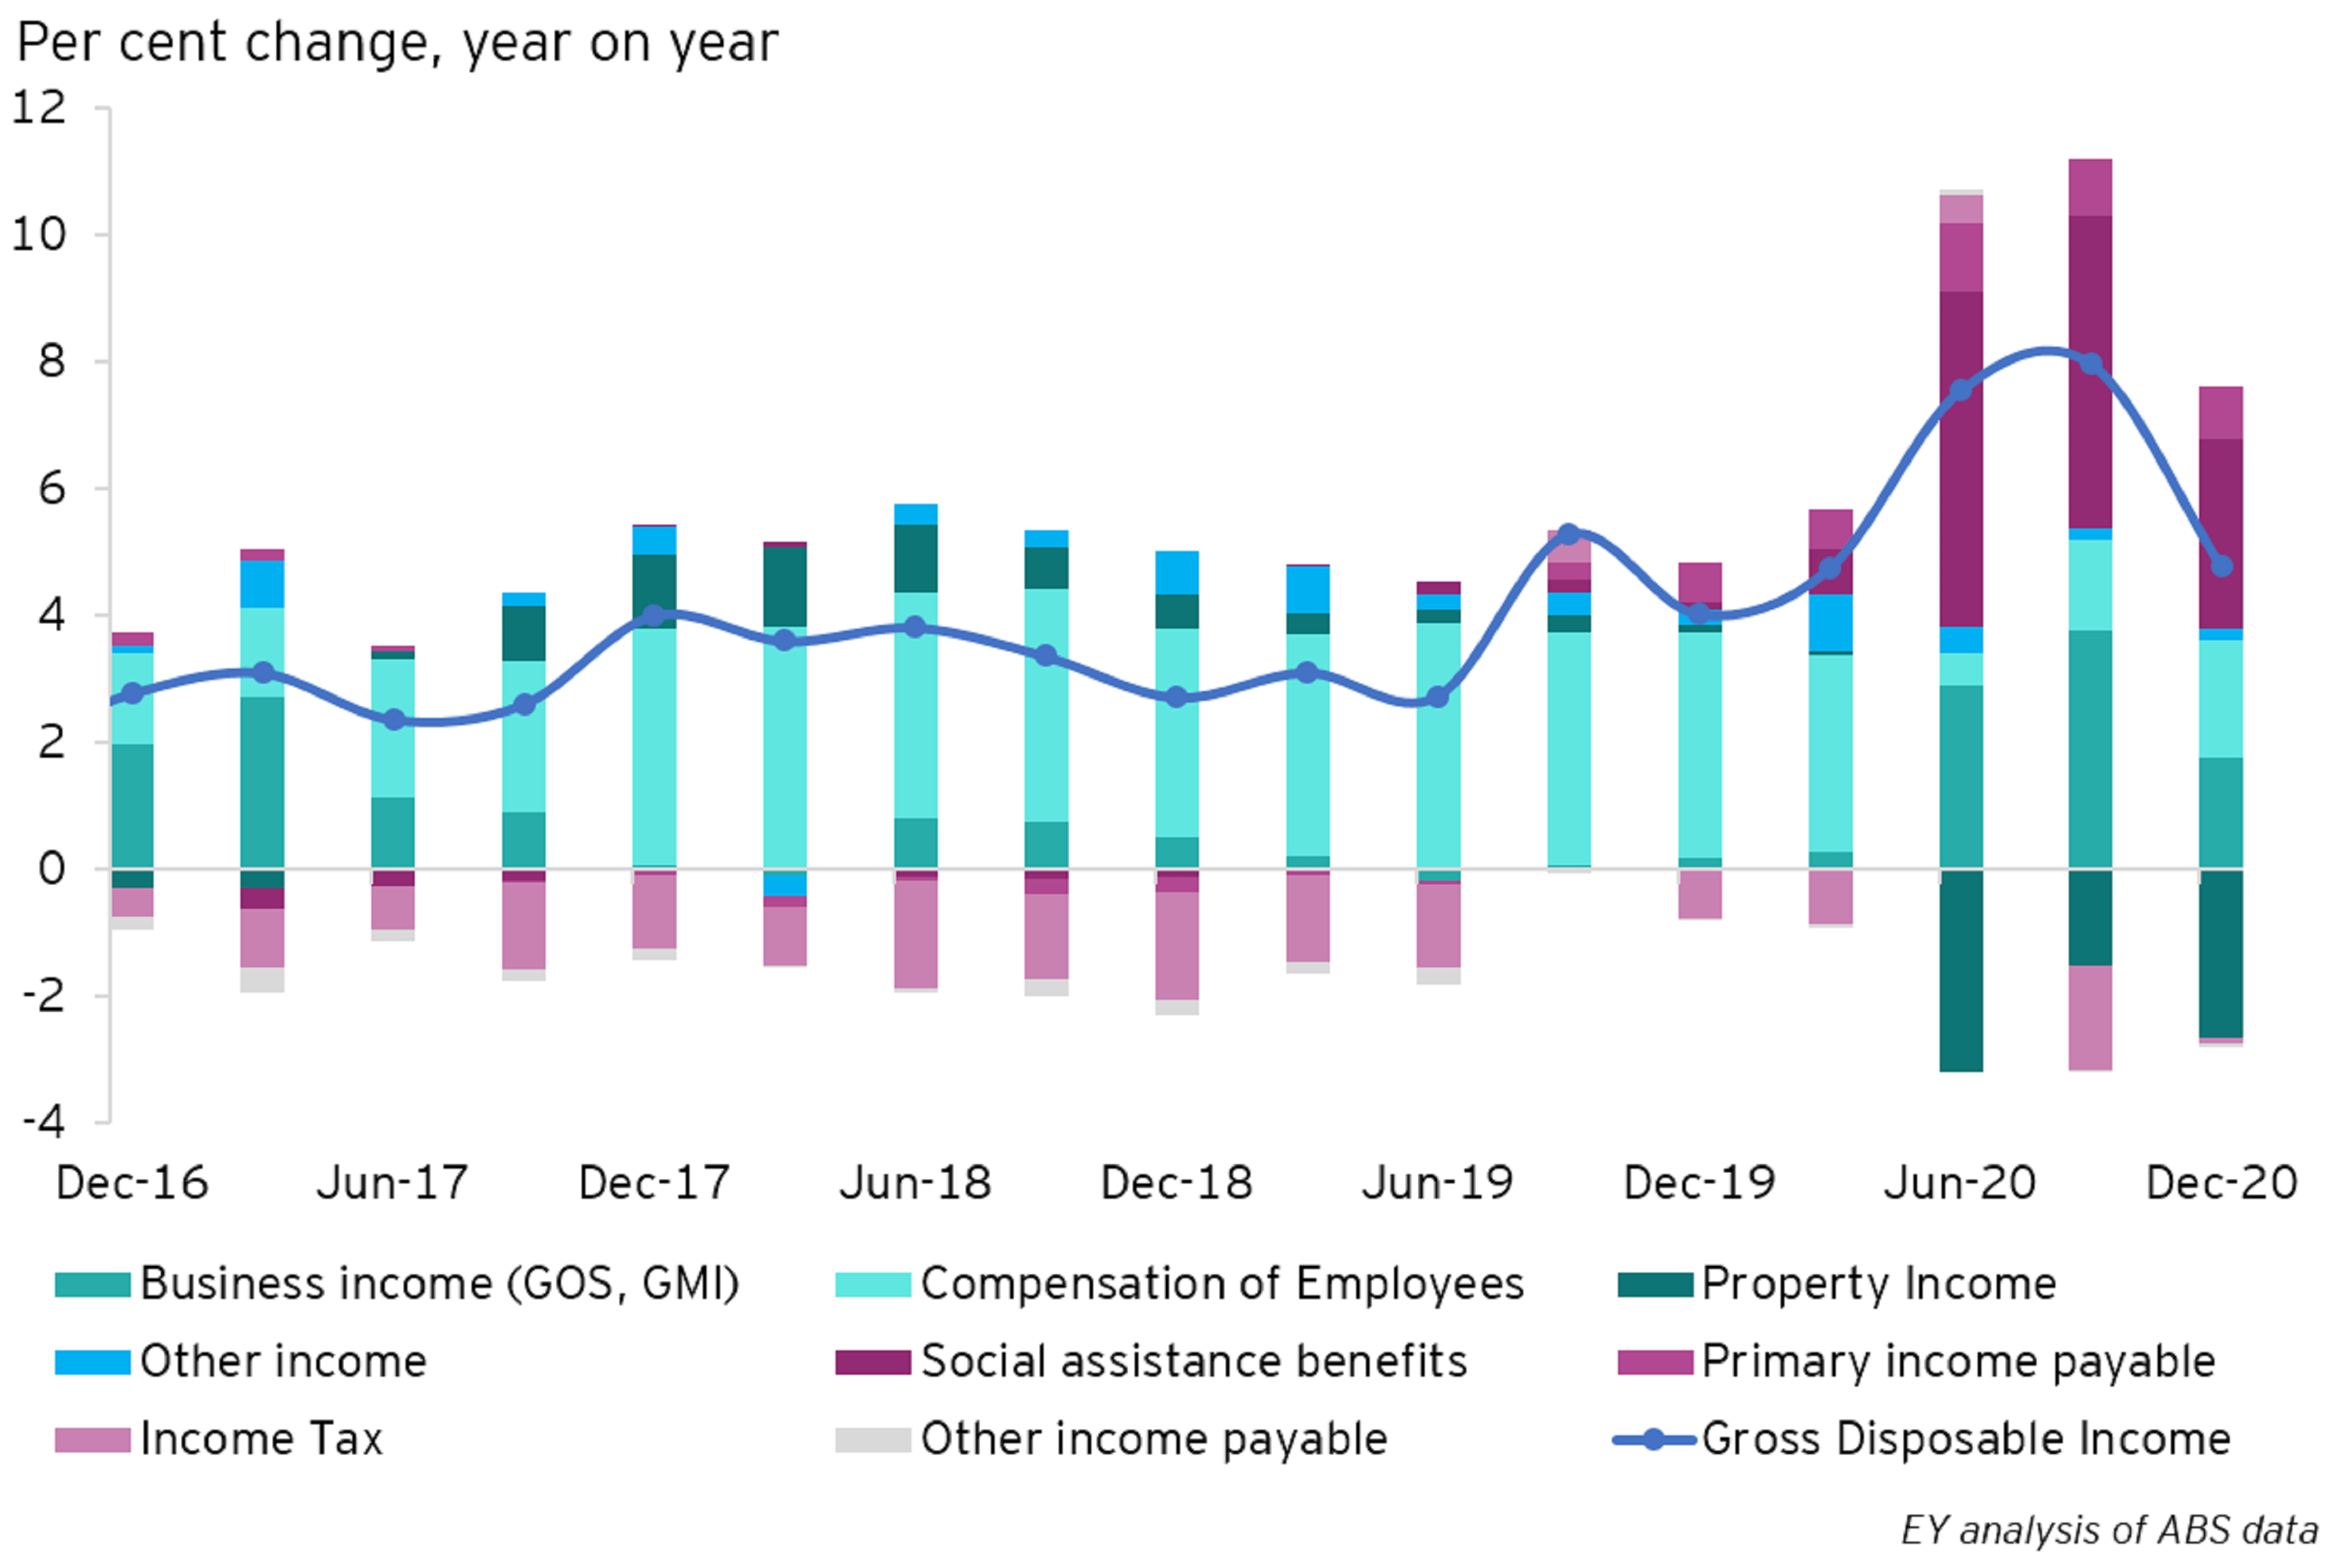
Such a positive outcome for household consumption suggests the household sector was able to absorb the step down in government support during the December quarter. Household disposable income fell by 3.1 per cent in the quarter but remains 4.8 per cent higher over the year. The decline in income was predictable due to lower social assistance benefits and lower business income, as JobSeeker and JobKeeper payments tapered during the quarter. JobKeeper payments have been boosting company profits, as business wage expenses fell.
Offsetting these declines in non-labour income was a 1.4 per cent increase in compensation of employees, which is now 2.5 per cent higher than a year ago. The growth in employee income is consistent with the recovery in employment during the quarter. Leading indicators of employment, such as ANZ Australia Job Advertisements data, suggest growth in employee earnings will continue into the March quarter and will play an important role in maintaining the economic recovery.
Household income growth remains elevated, as government support tapers, wages growth will need to lift
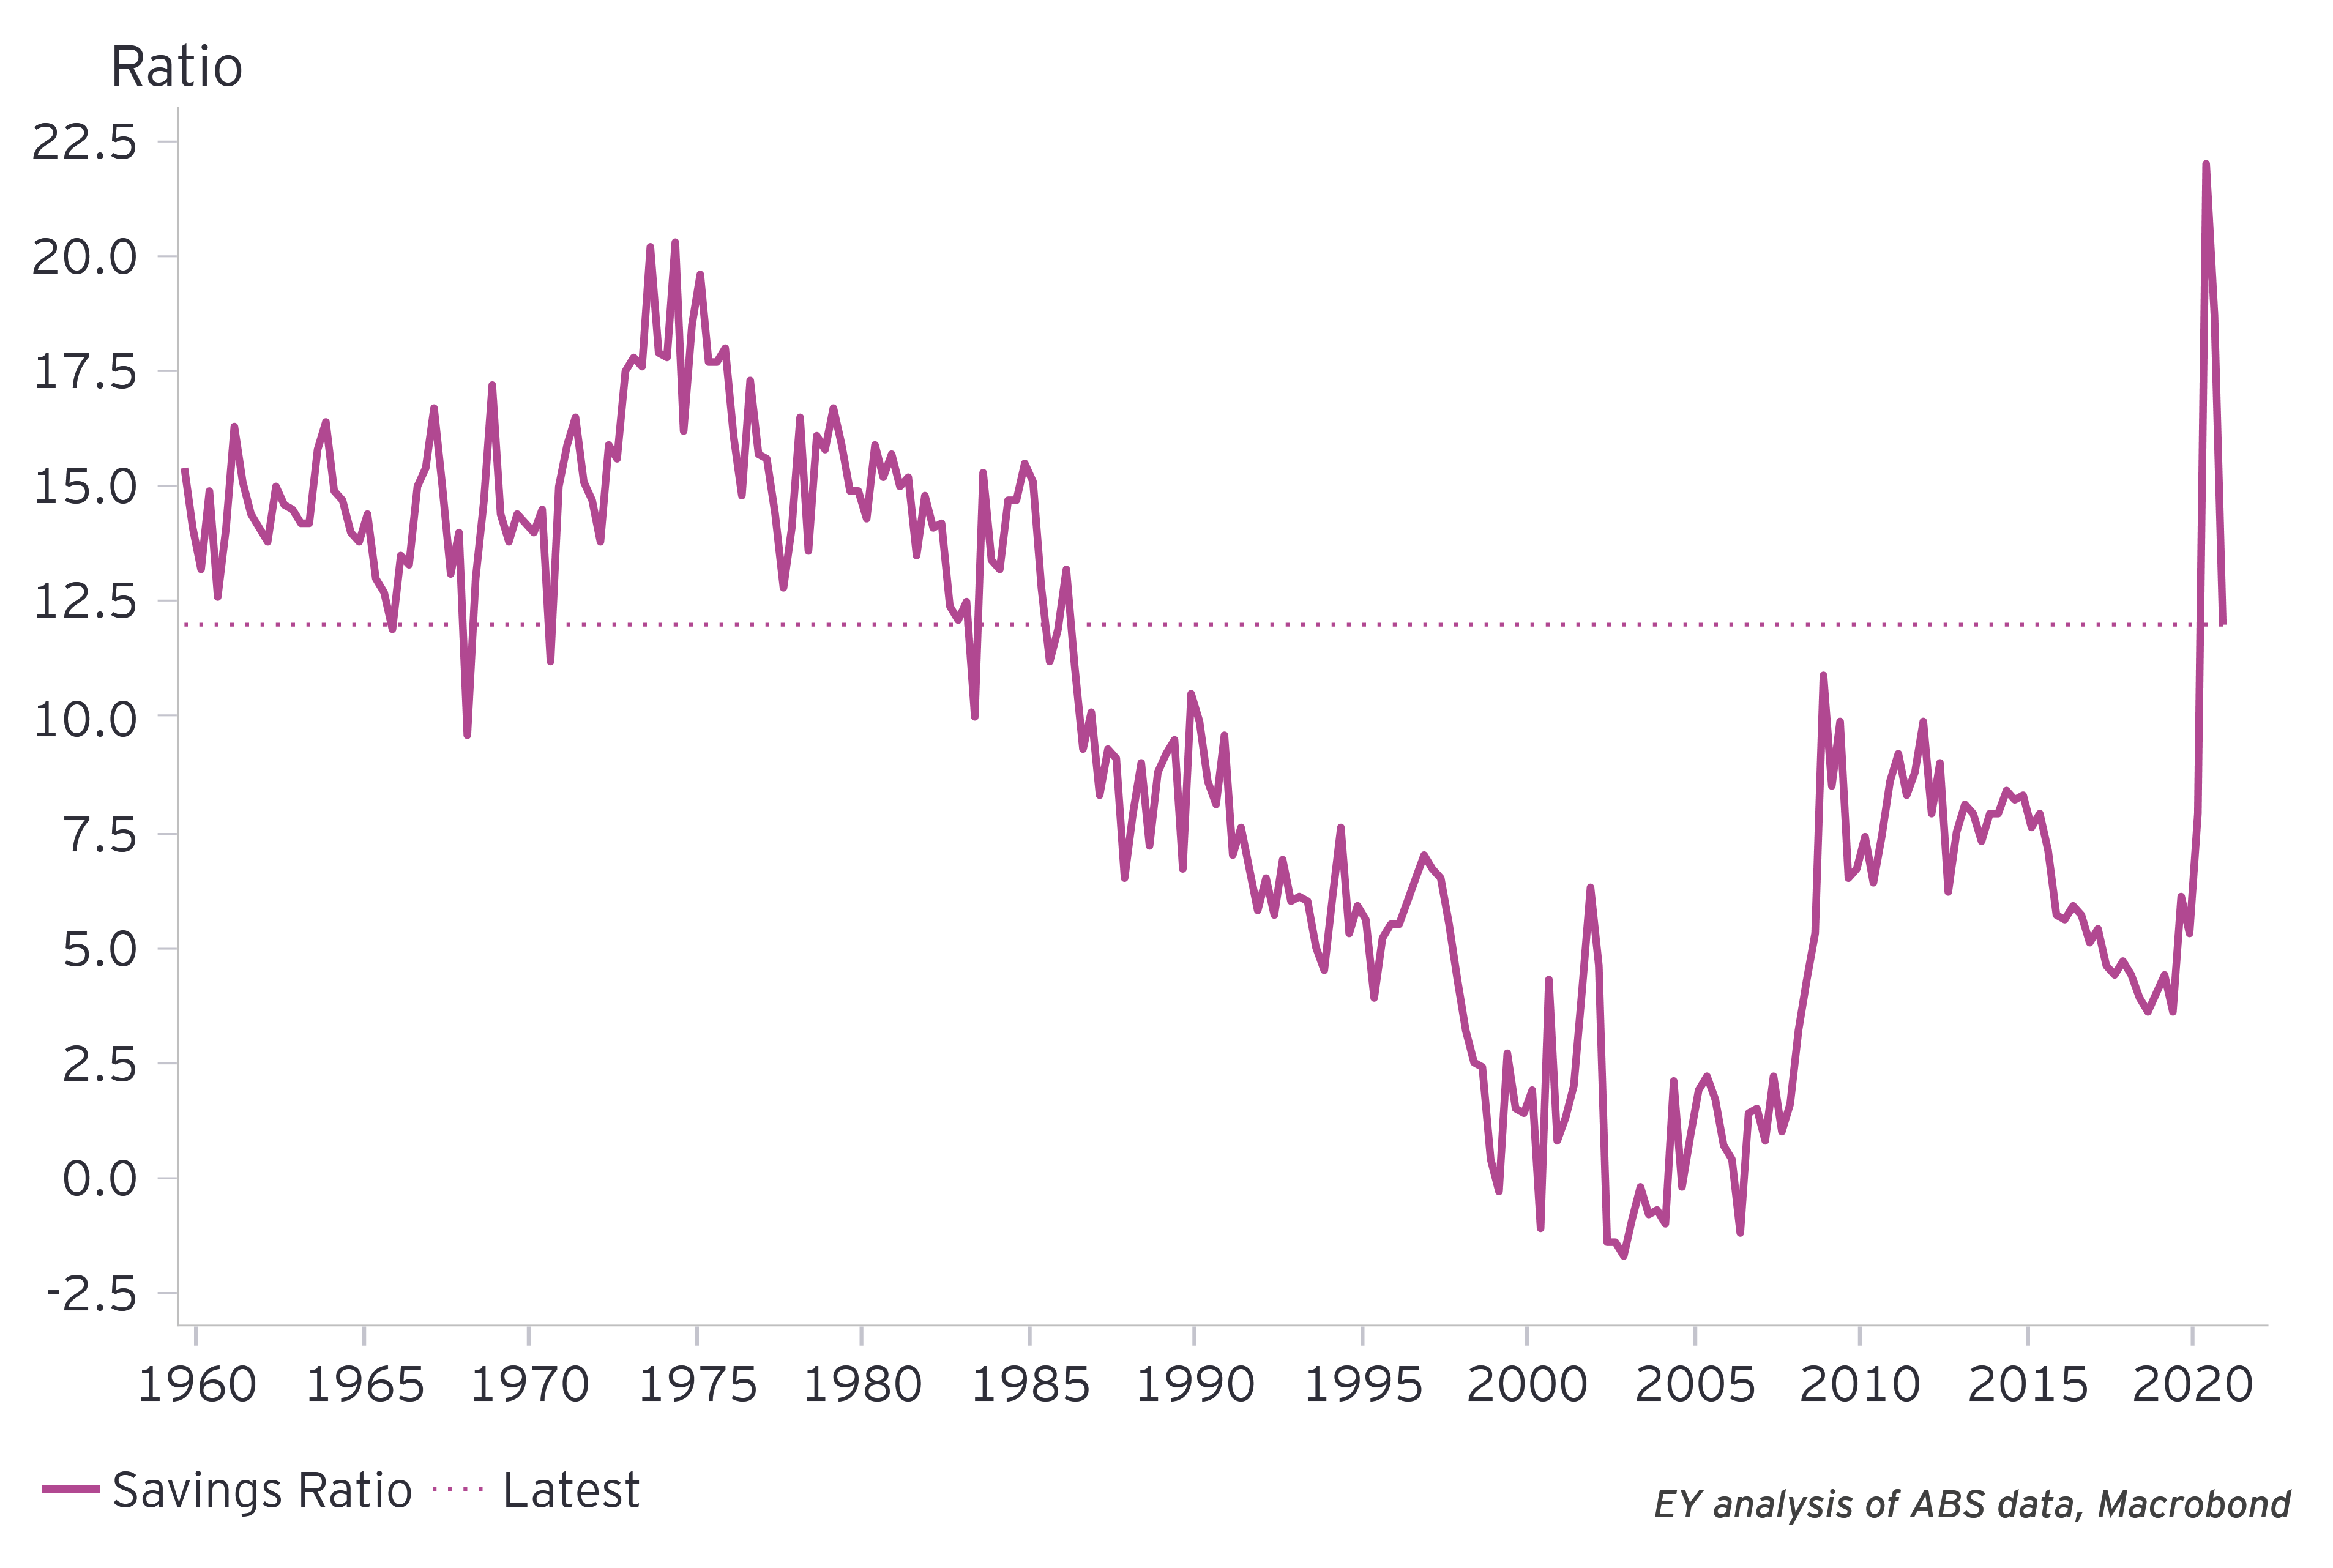
The lift in employee income during the quarter supported household ability to get out and spend but so did their war-chest of savings. Households chose to save less during the quarter to support the rise in consumption, with the household savings rate falling from 18.7 per cent to 12 per cent. This still represents an increase in savings and is a much faster rate than the 5.3 per cent rate Australia had prior to the pandemic. Ongoing support for consumption requires the savings rate to continue to trend lower, which will be reliant on consumer confidence and job security.
Government support and this build-up of savings has bolstered household balance sheets. Indeed, since February 2020, household deposits at Authorised Deposit-taking Institutions (ADIs) have increased by $123.8 billion. Together with increasing house prices and equity markets, Australian household wealth is in a good position - this should support consumption going forward. Historical relationships suggest a 1 per cent increase household wealth will lead to a permanent 0.16 per cent increase in household consumption.
Household savings rate remains elevated

Government sector
The public sector continues to make a meaningful contribution
Infrastructure investment and government services boost growth even as the budget balance improves.
The public sector continues to make a meaningful contribution to economic growth. Both government consumption and investment made solid contributions to activity during the quarter, as public demand increased by 1.1 per cent to be an impressive 6.2 per cent higher than a year ago.
Government consumption – i.e. service delivery – continues to make the largest year on year contribution to economic growth, adding 1.4 ppt to annual GDP growth. The substantial lift in government consumption over the past year has been supported by several COVID-19 related government programs including additional spending on clinical and non-clinical (police, contact tracing) staff, spending on PPE, government advertisements and expanded digital health and telehealth services. All levels of government appear to have shared the cost of supporting growth – federal, state and local.
Government investment also added to growth during Q4, as both the state and federal governments looked to accelerate projects already in the pipeline at the end of last year. Public investment rose by 2.5 per cent during the quarter, led by a 2.9 per cent rise in state and local investment. There has been a clear acceleration in state and local investment since the start of the pandemic – with year on year growth lifting from 1.3 per cent in Q4 2019 to 6.8 per cent in Q4 2020.
Over the coming year, the contribution from government investment should remain at elevated levels with several federal and state infrastructure projects entering their construction phase including the Inland Rail, Melbourne’s North East link and Sydney’s Metro-West line. For more on the State Budgets and their planned expenditure see our recent article here.
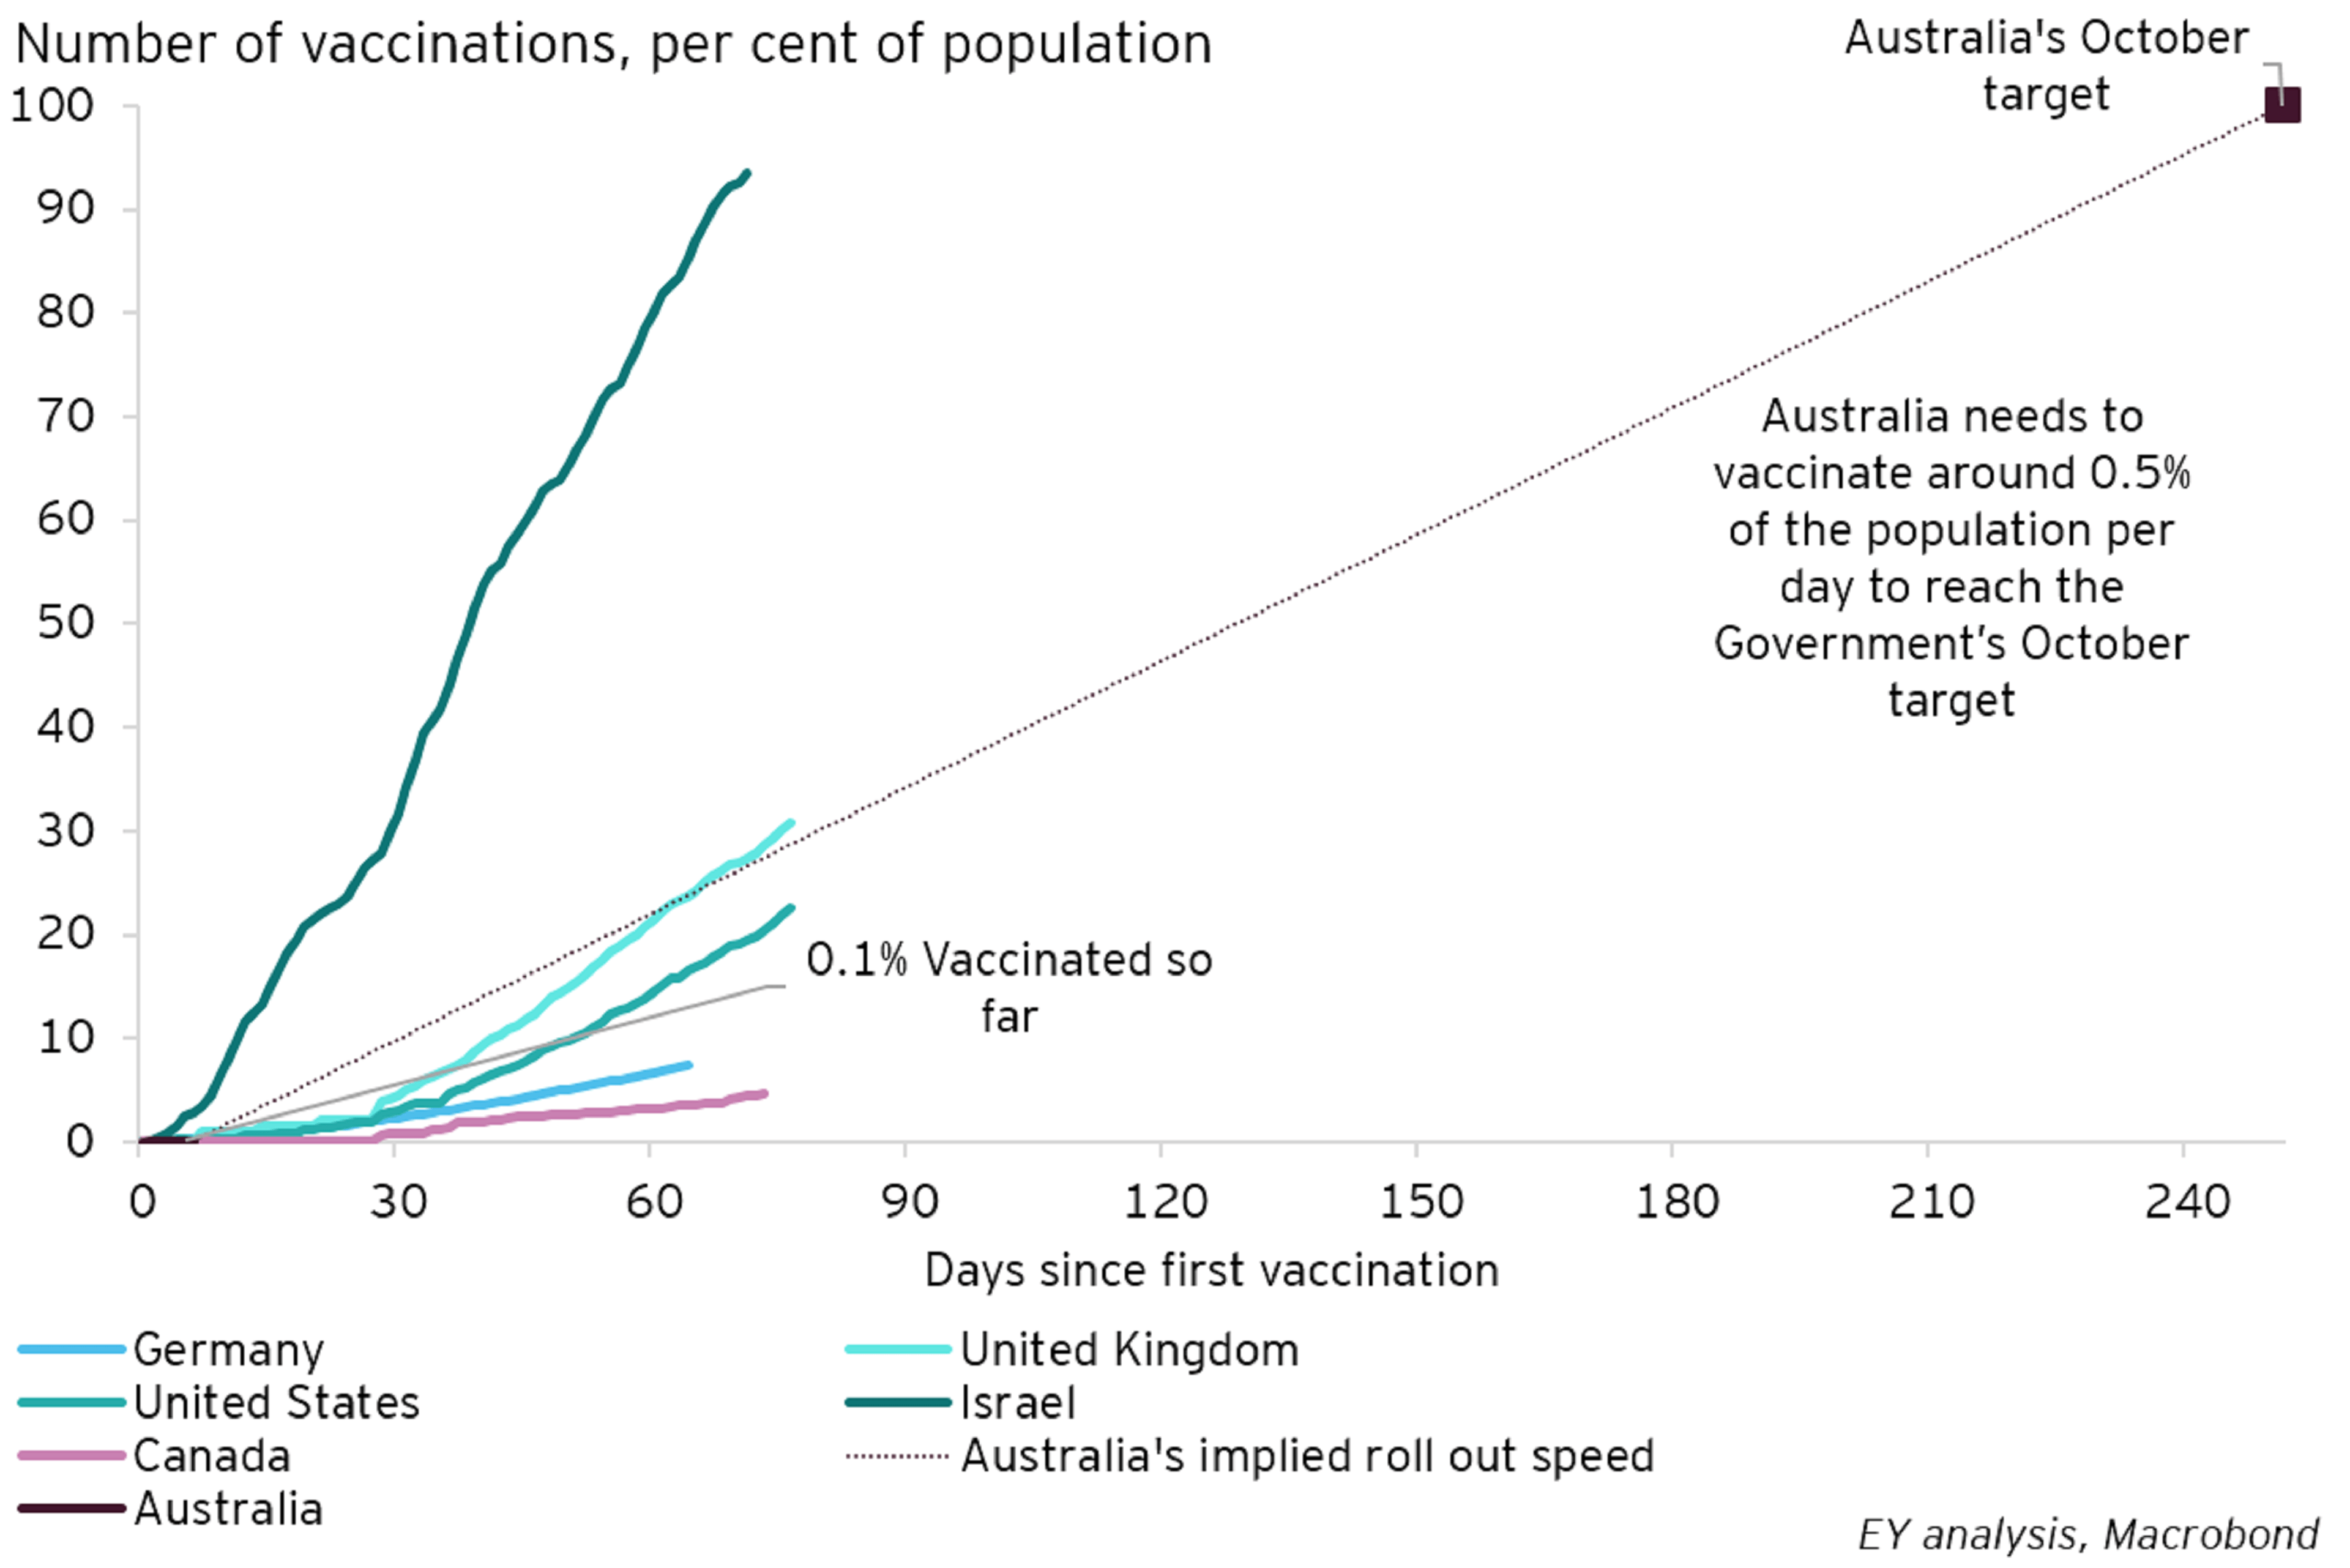
Over the next year, government consumption will be supported by the mass roll out of COVID-19 vaccines - a massive logistical exercise that will require the public and private sector to work together if Australia is to meet its’ October target. This exercise will directly boost economic activity across the supply chain and will also indirectly boost activity by lifting confidence and reducing the need for social distancing and border closures. EY modelling suggests social distancing had the largest economic impact of any health regulation at the peak of the crisis. The October target for mass roll out at this stage looks achievable, provided the speed of the roll out accelerates to be more in line with the United States and United Kingdom rather than Germany or Canada.
The mass roll out of Australia’s COVID vaccines will boost activity and confidence
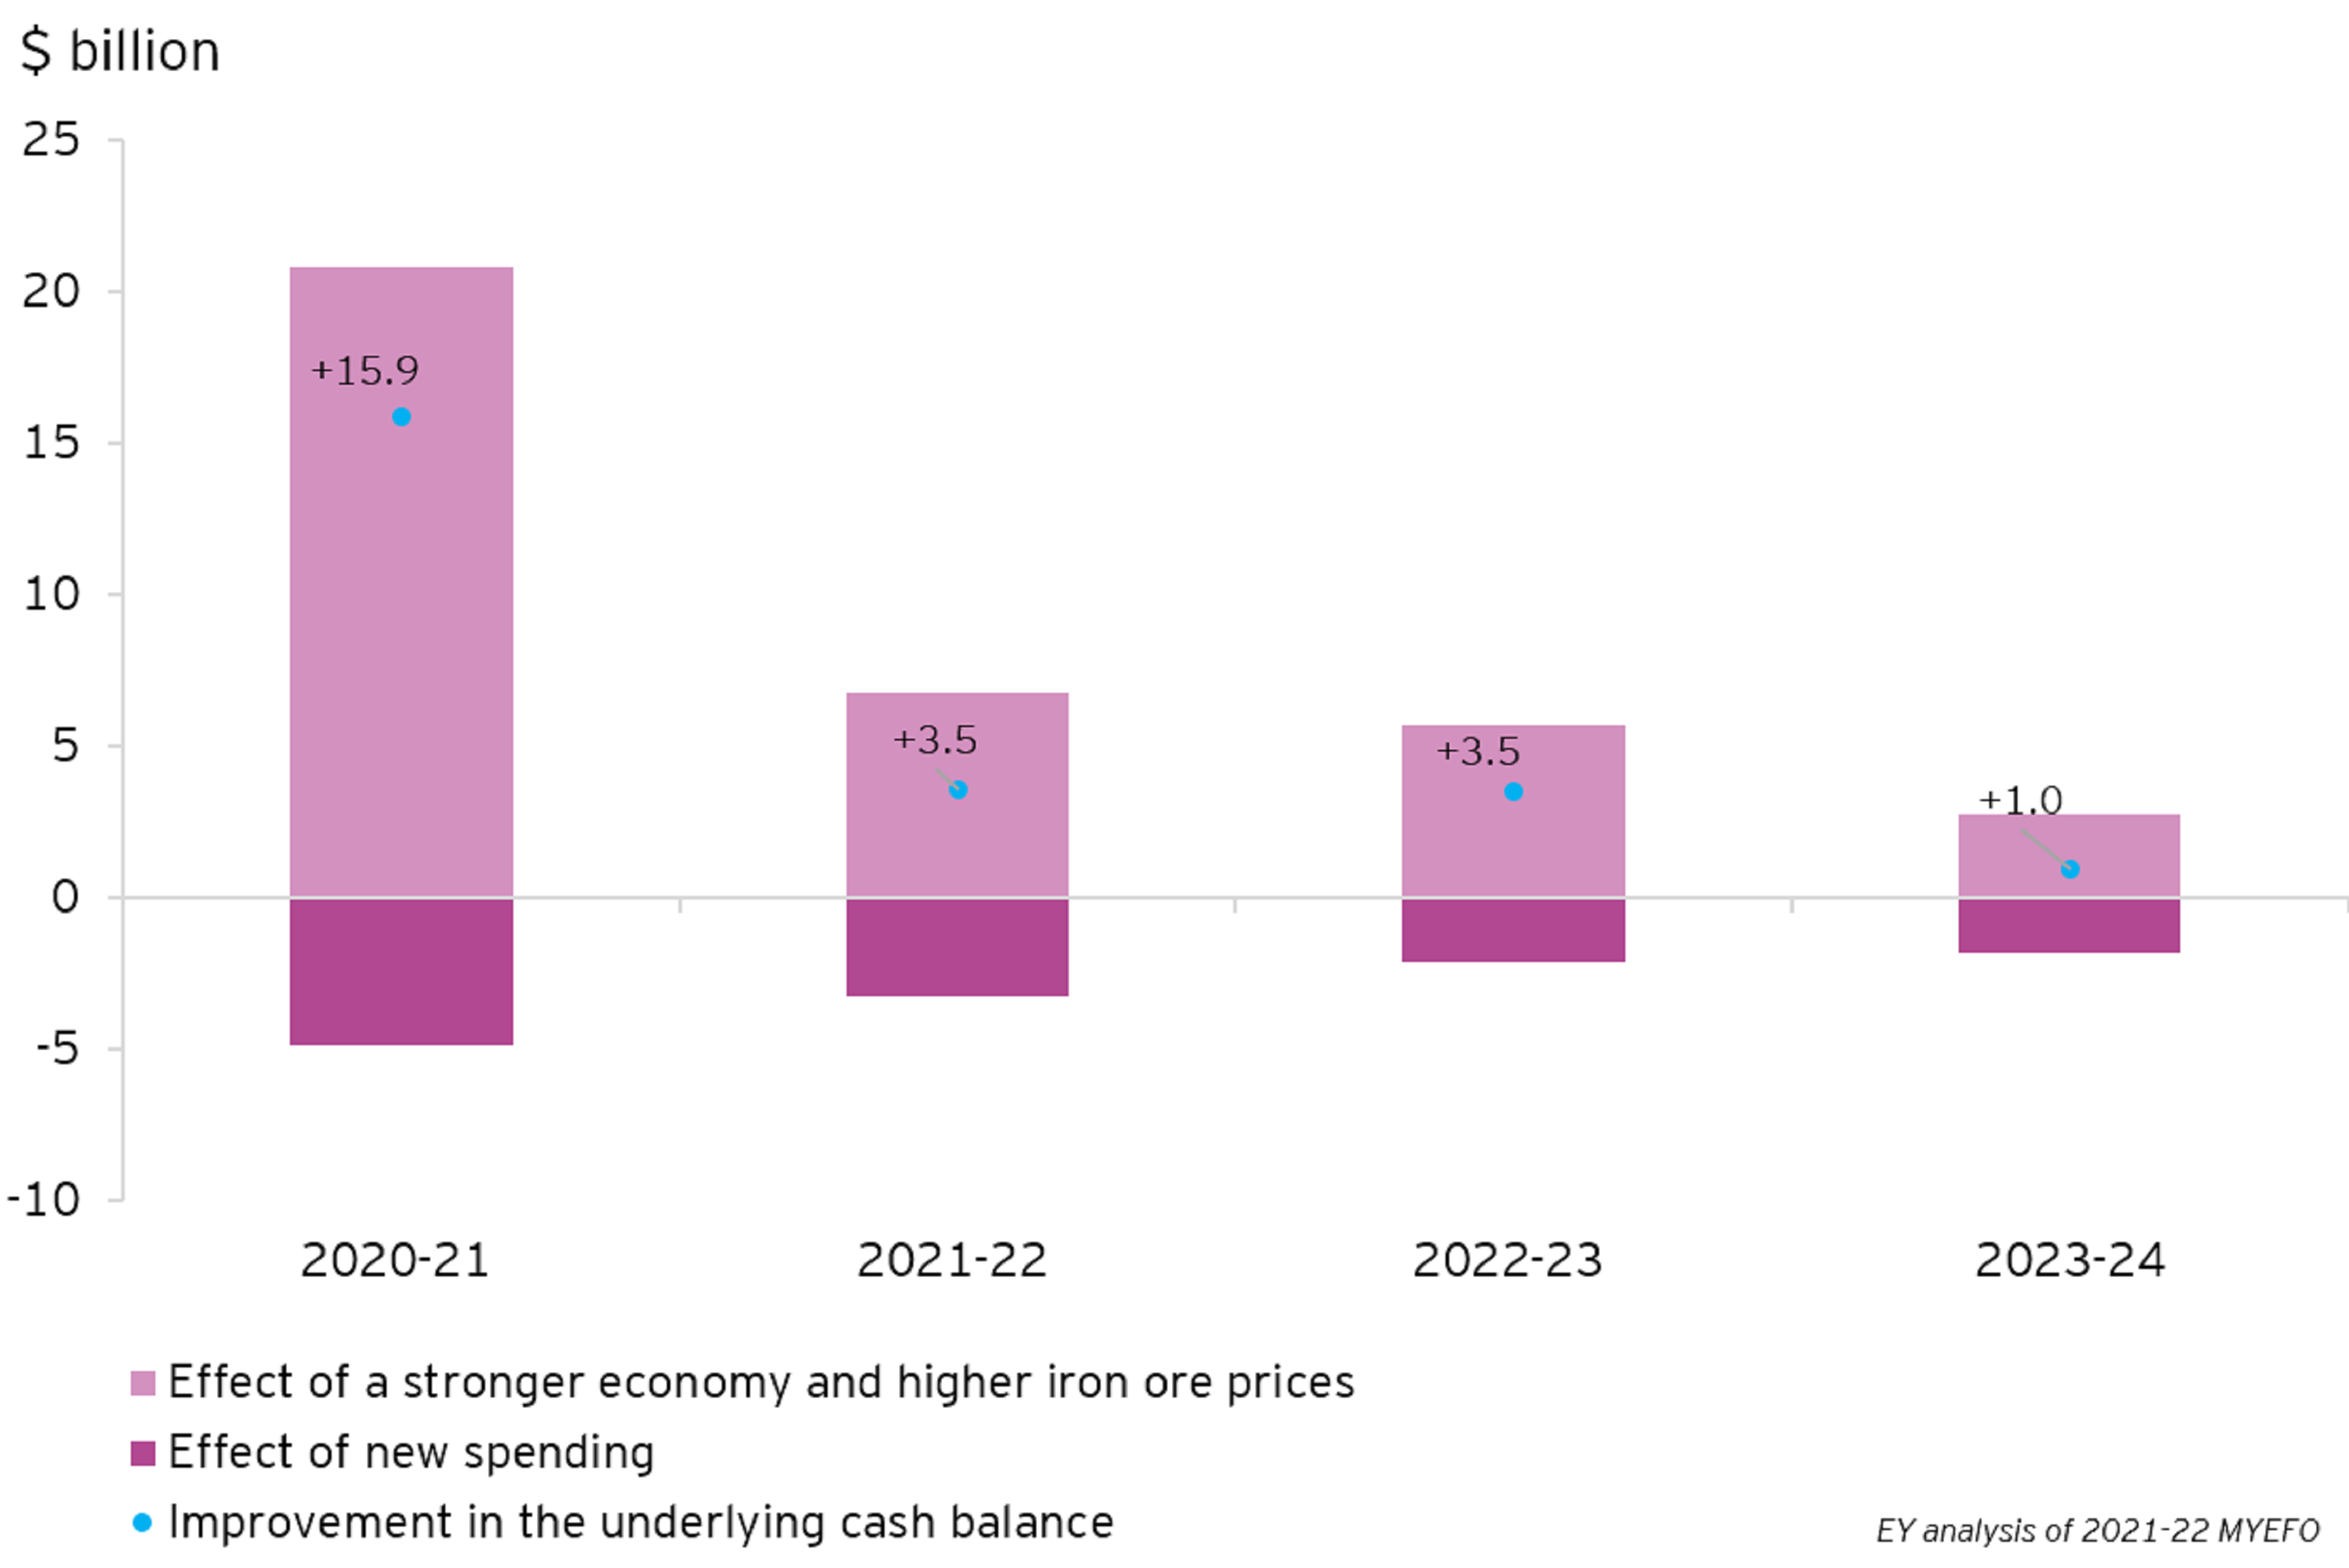
Consistent with the economy recovering quicker than expected the Federal Budget’s bottom line has continued to outperform expectations. The improvement in the government’s budget position was clear in the recently released Mid-Year Economic and Fiscal Outlook (MYEFO), where the underlying cash deficit fell by $15.9 billion in 2020-21.
This improvement has continued even since the MYEFO’s release, the result of both less expenses and greater tax revenues. As of December, the underlying cash balance was -$116 billion, which is around $10 billion higher than even the MYEFO’s upwardly revised profile.
Higher iron ore prices continue to be a large driver of the improvement in the budget balance – through higher company taxes. The iron ore price has remained above US$150/tonne since the start of the calendar year, well in excess of the MYEFO’s assumed decline to US$55/tonne free-on-board by the end of Q3 2021.
The Q4 national account set the base for the 2021/22 federal budget, expected mid-May. The budget will have an improved starting point and while the strength of the economy warrants a move away from large, broad-based support measures, like JobKeeper, the national unemployment is still above Treasurer Frydenberg's target 6 per cent for budget repair, and it's likely the improvement in the unemployment rate will slow from here. It also does not look like a big, bold reform agenda is on the table this year.
A stronger economy and higher iron ore prices have boosted the budget bottom line

Net-exports
Net exports detract from growth as imports recover faster than exports
Net-exports detracted 0.1 ppt from quarterly growth, as imports growth of 4.9 per cent, exceeded export growth of 3.8 per cent.
Exports are one area of the economy where the recovery remains very uneven. Some exports have responded to improving global growth – for example iron ore – while international borders continue to limit Australian service exports notably tourism and education.
While the volume of iron ore exports fell by 2.1 per cent in the December quarter, the high price of iron ore has pushed nominal exports in the commodity to a new record high in excess of $40 billion in the quarter. Good growing conditions has supported rural exports. The December saw strong growth in exports of cereals, with volumes more than doubling in the quarter driven primarily by a bumper wheat crop and strong growth in barley.
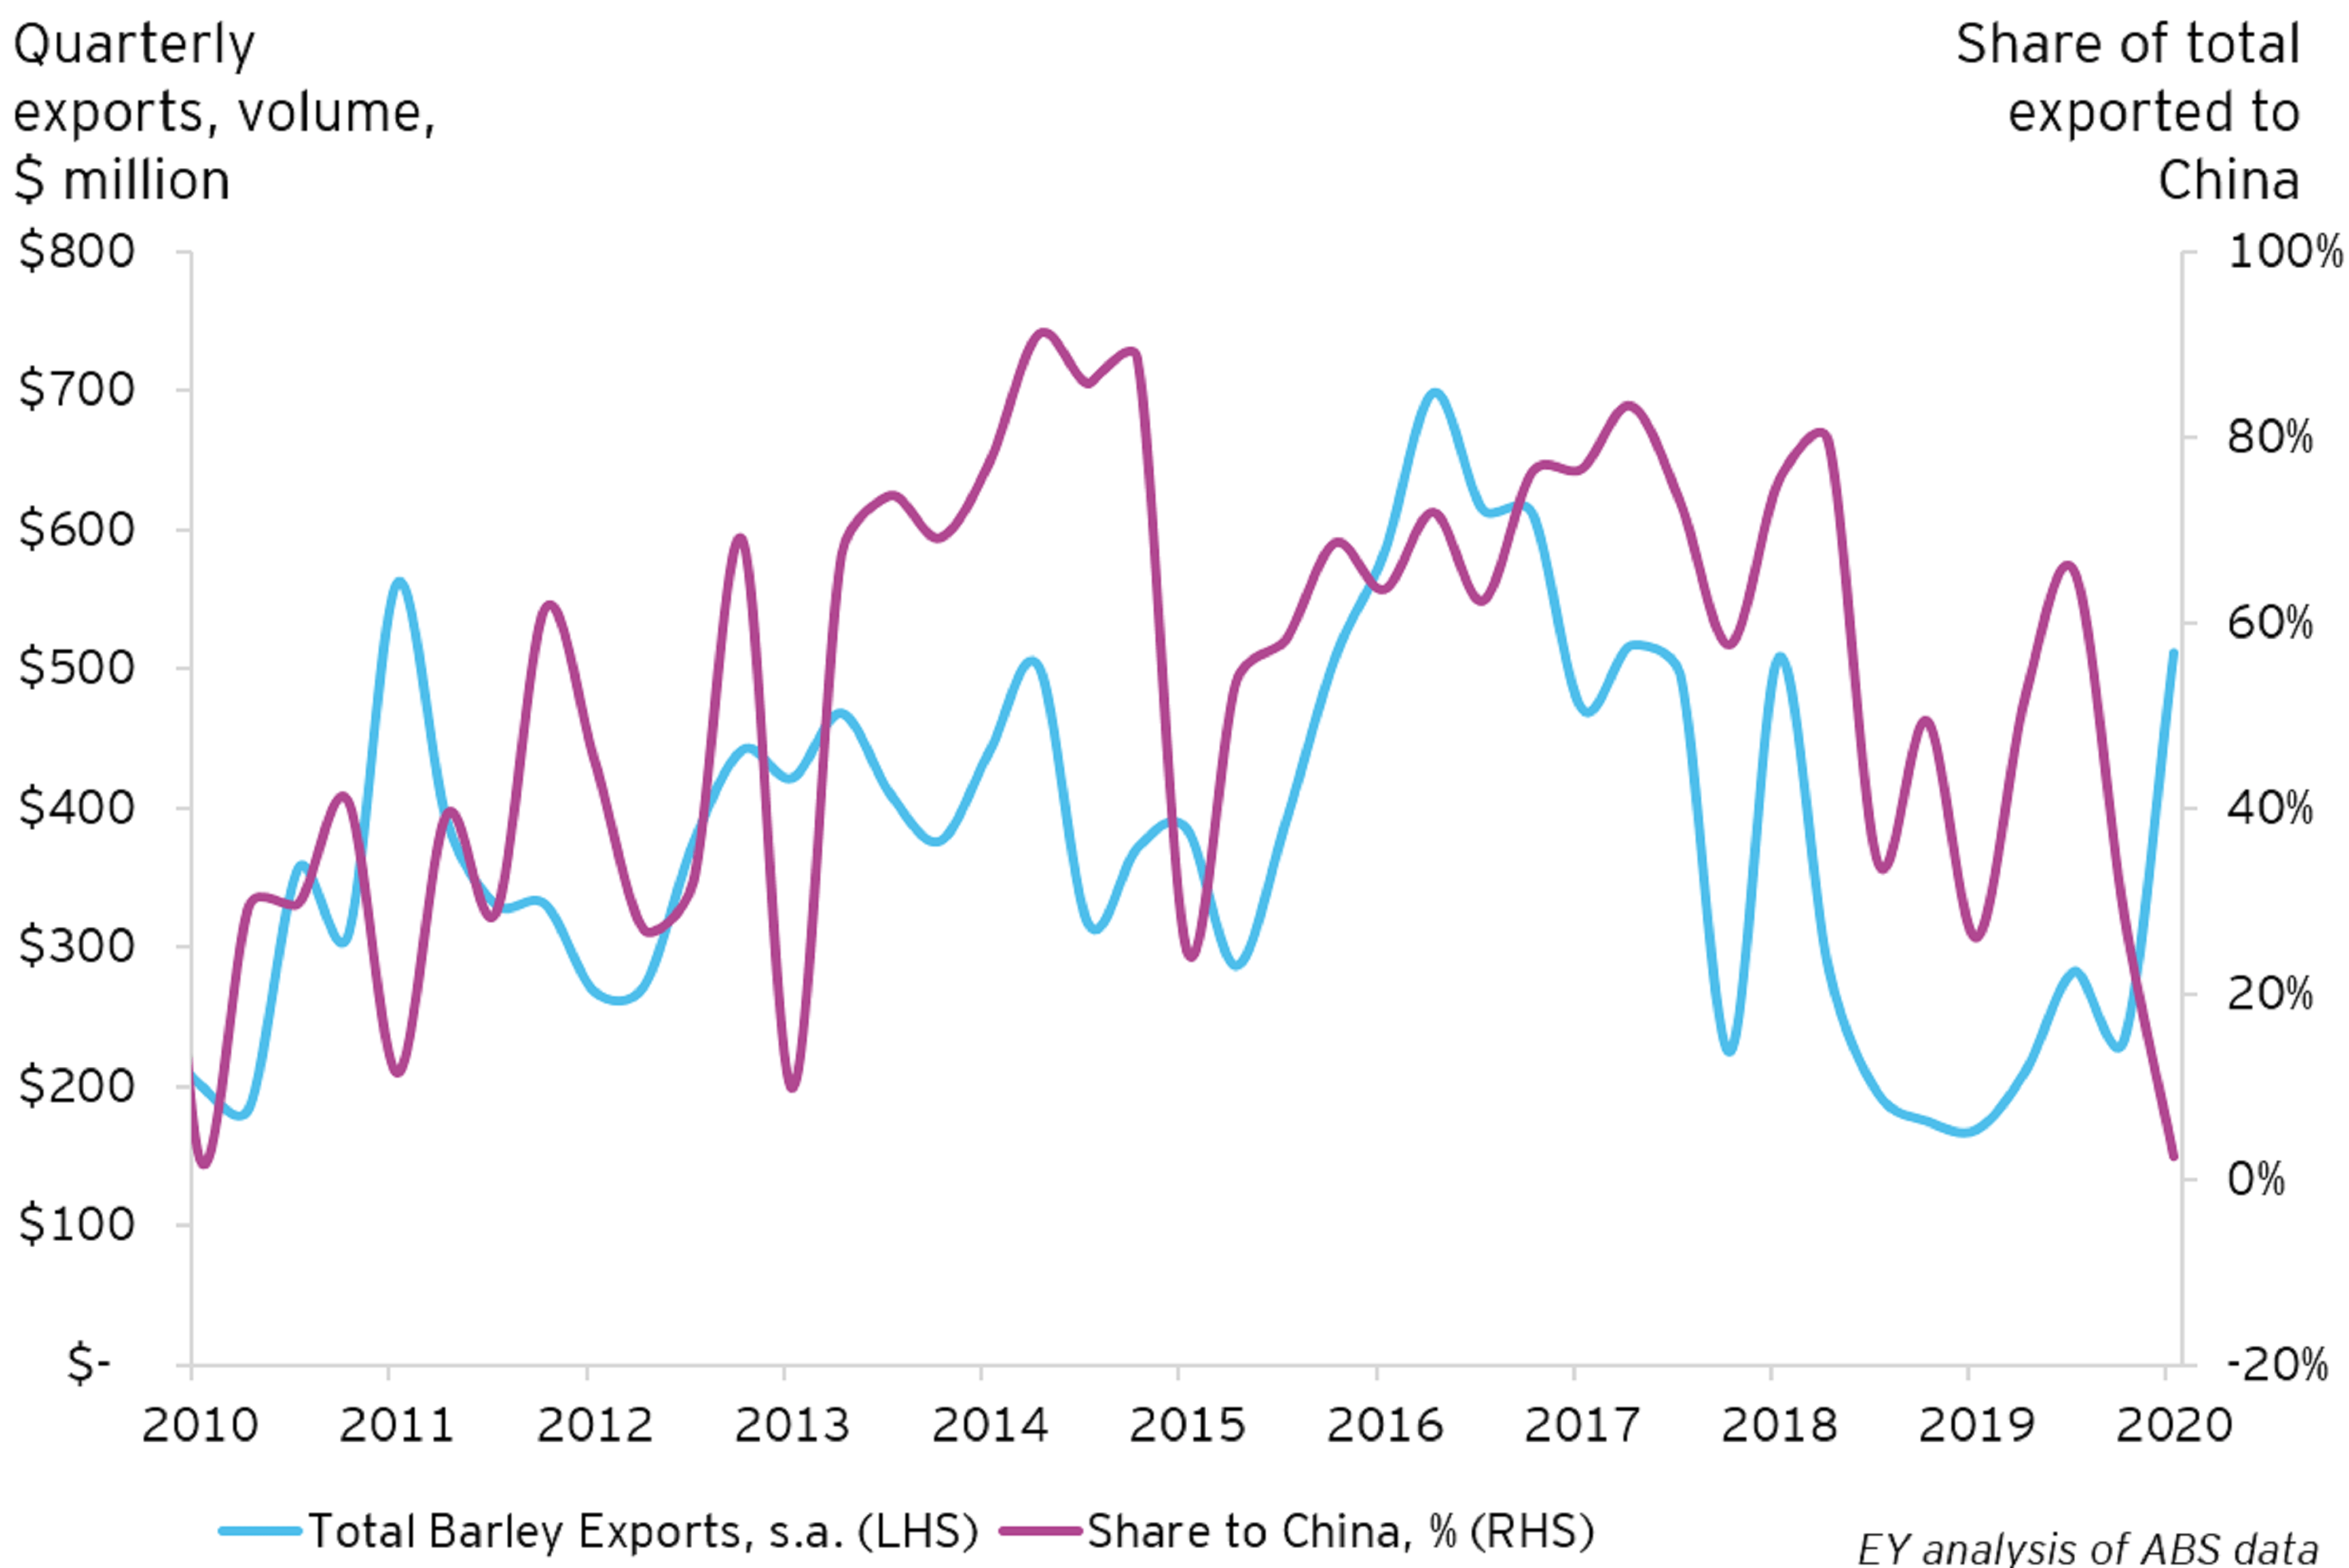
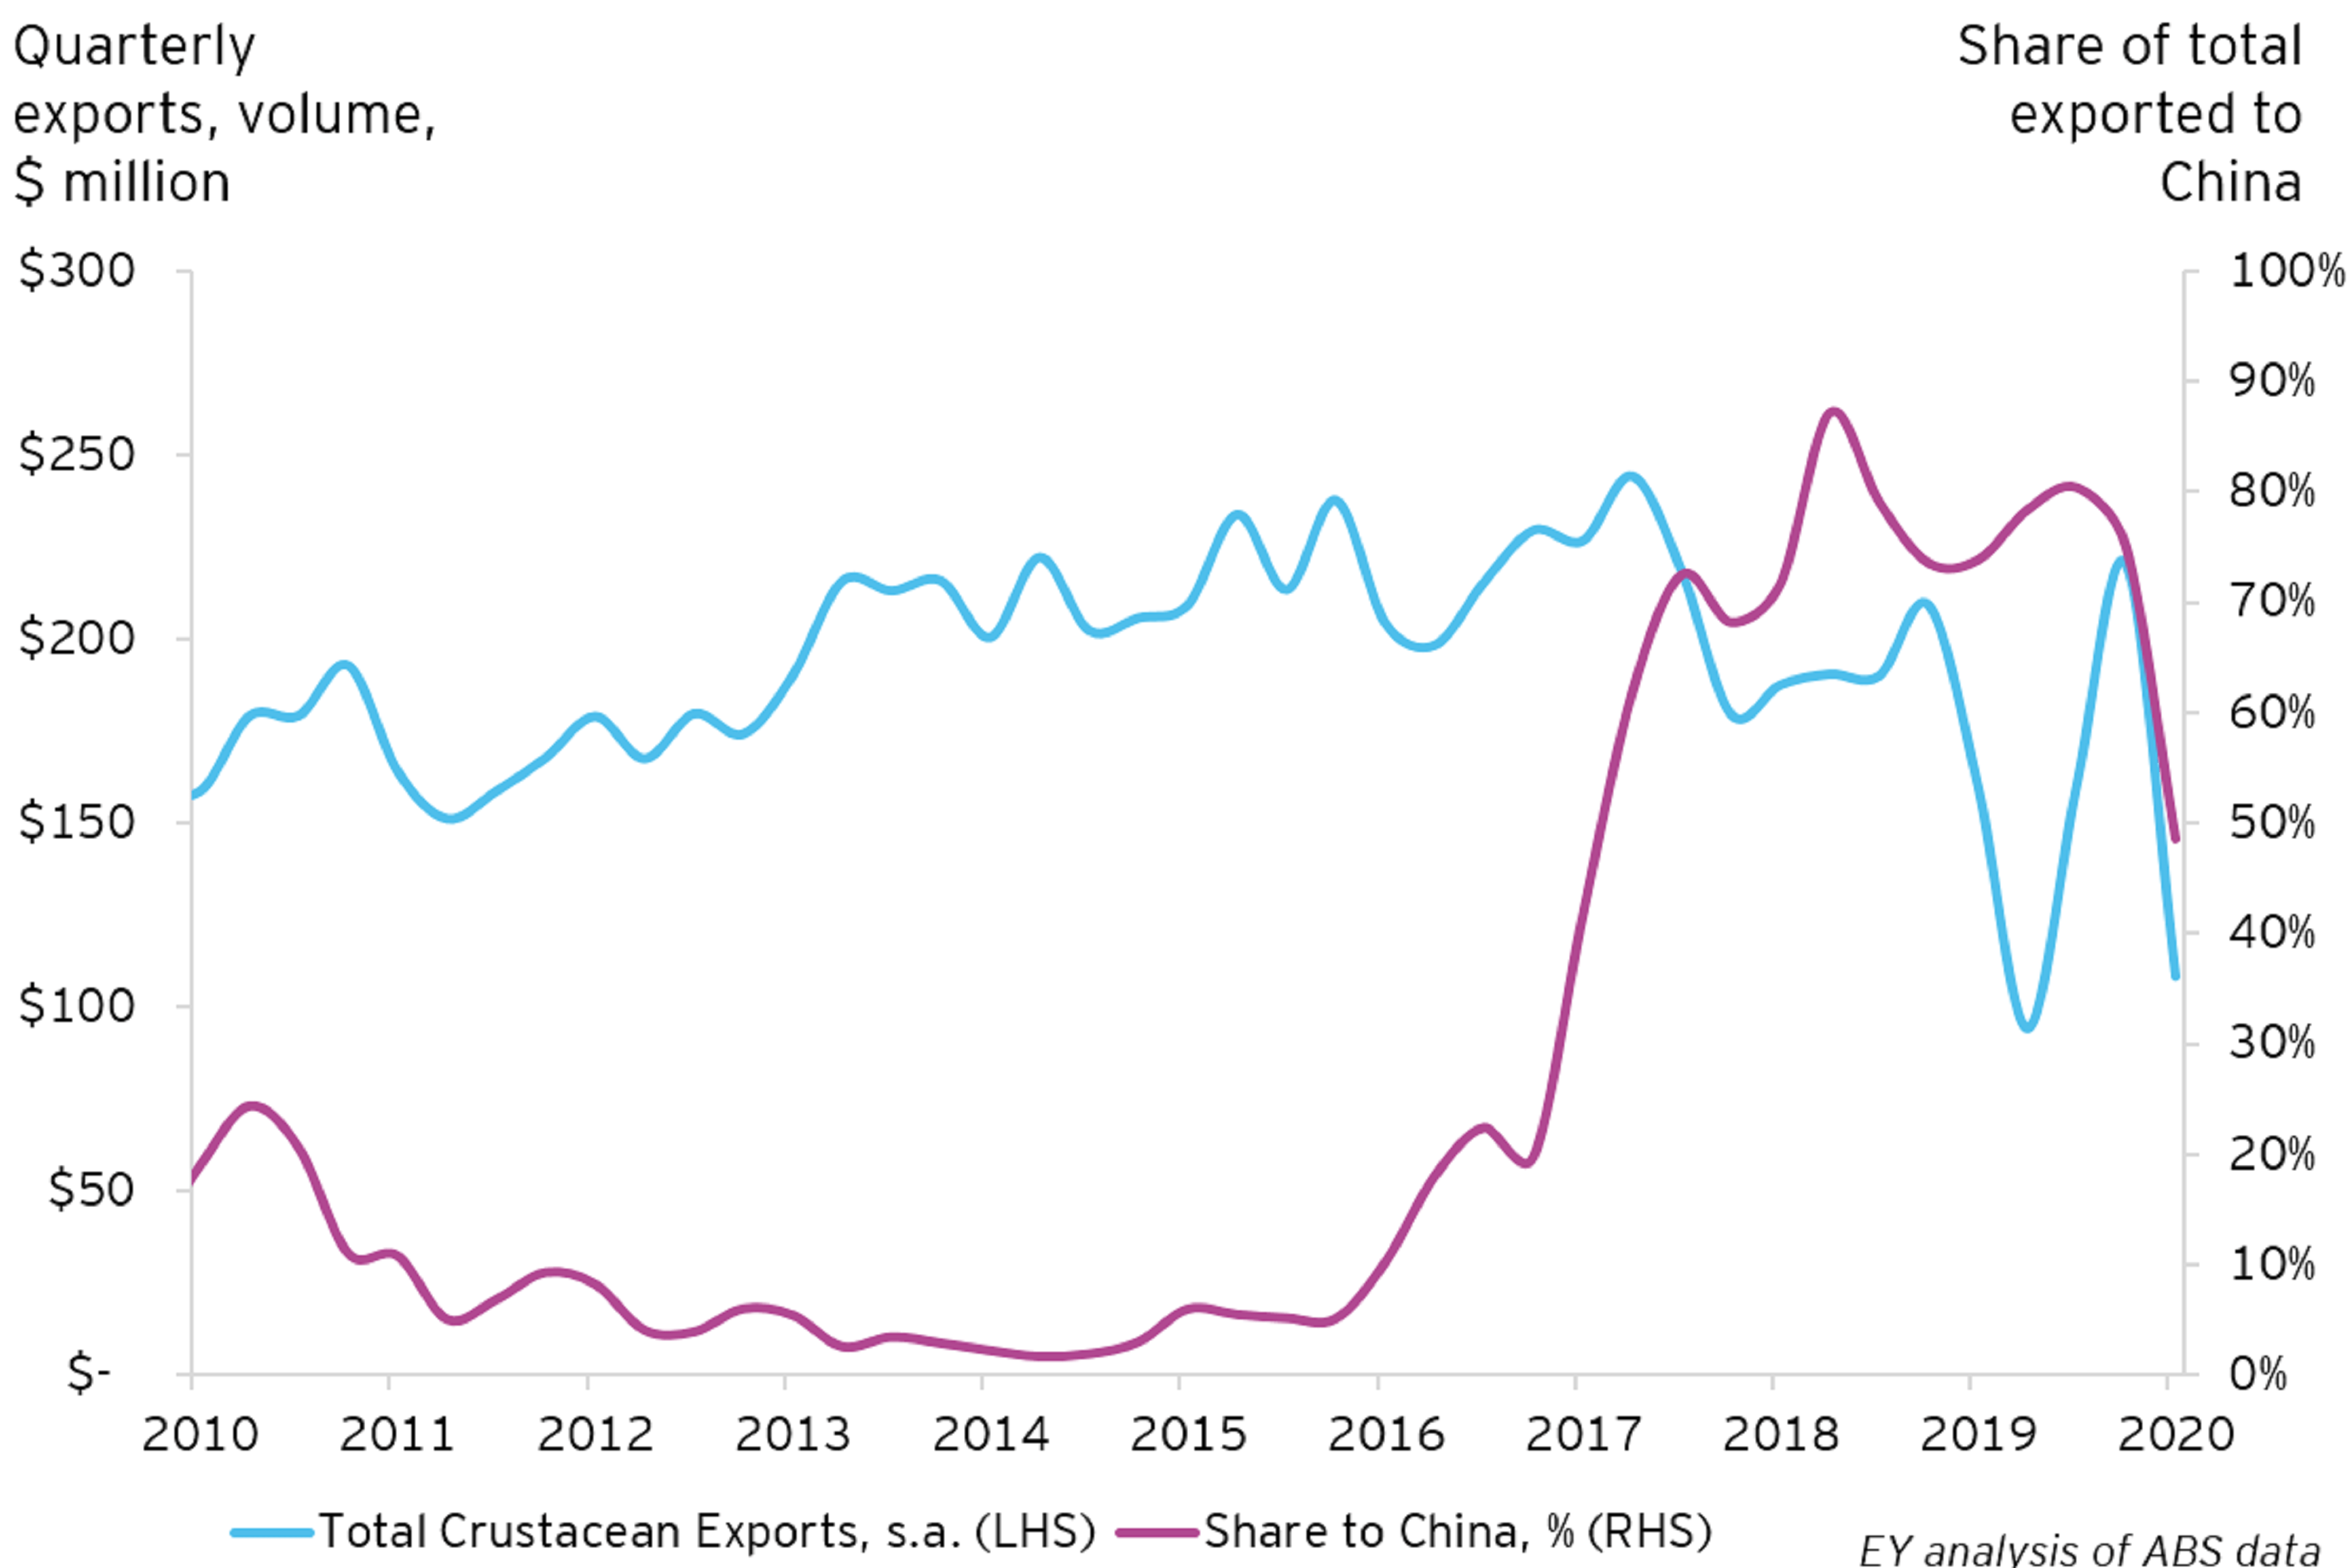
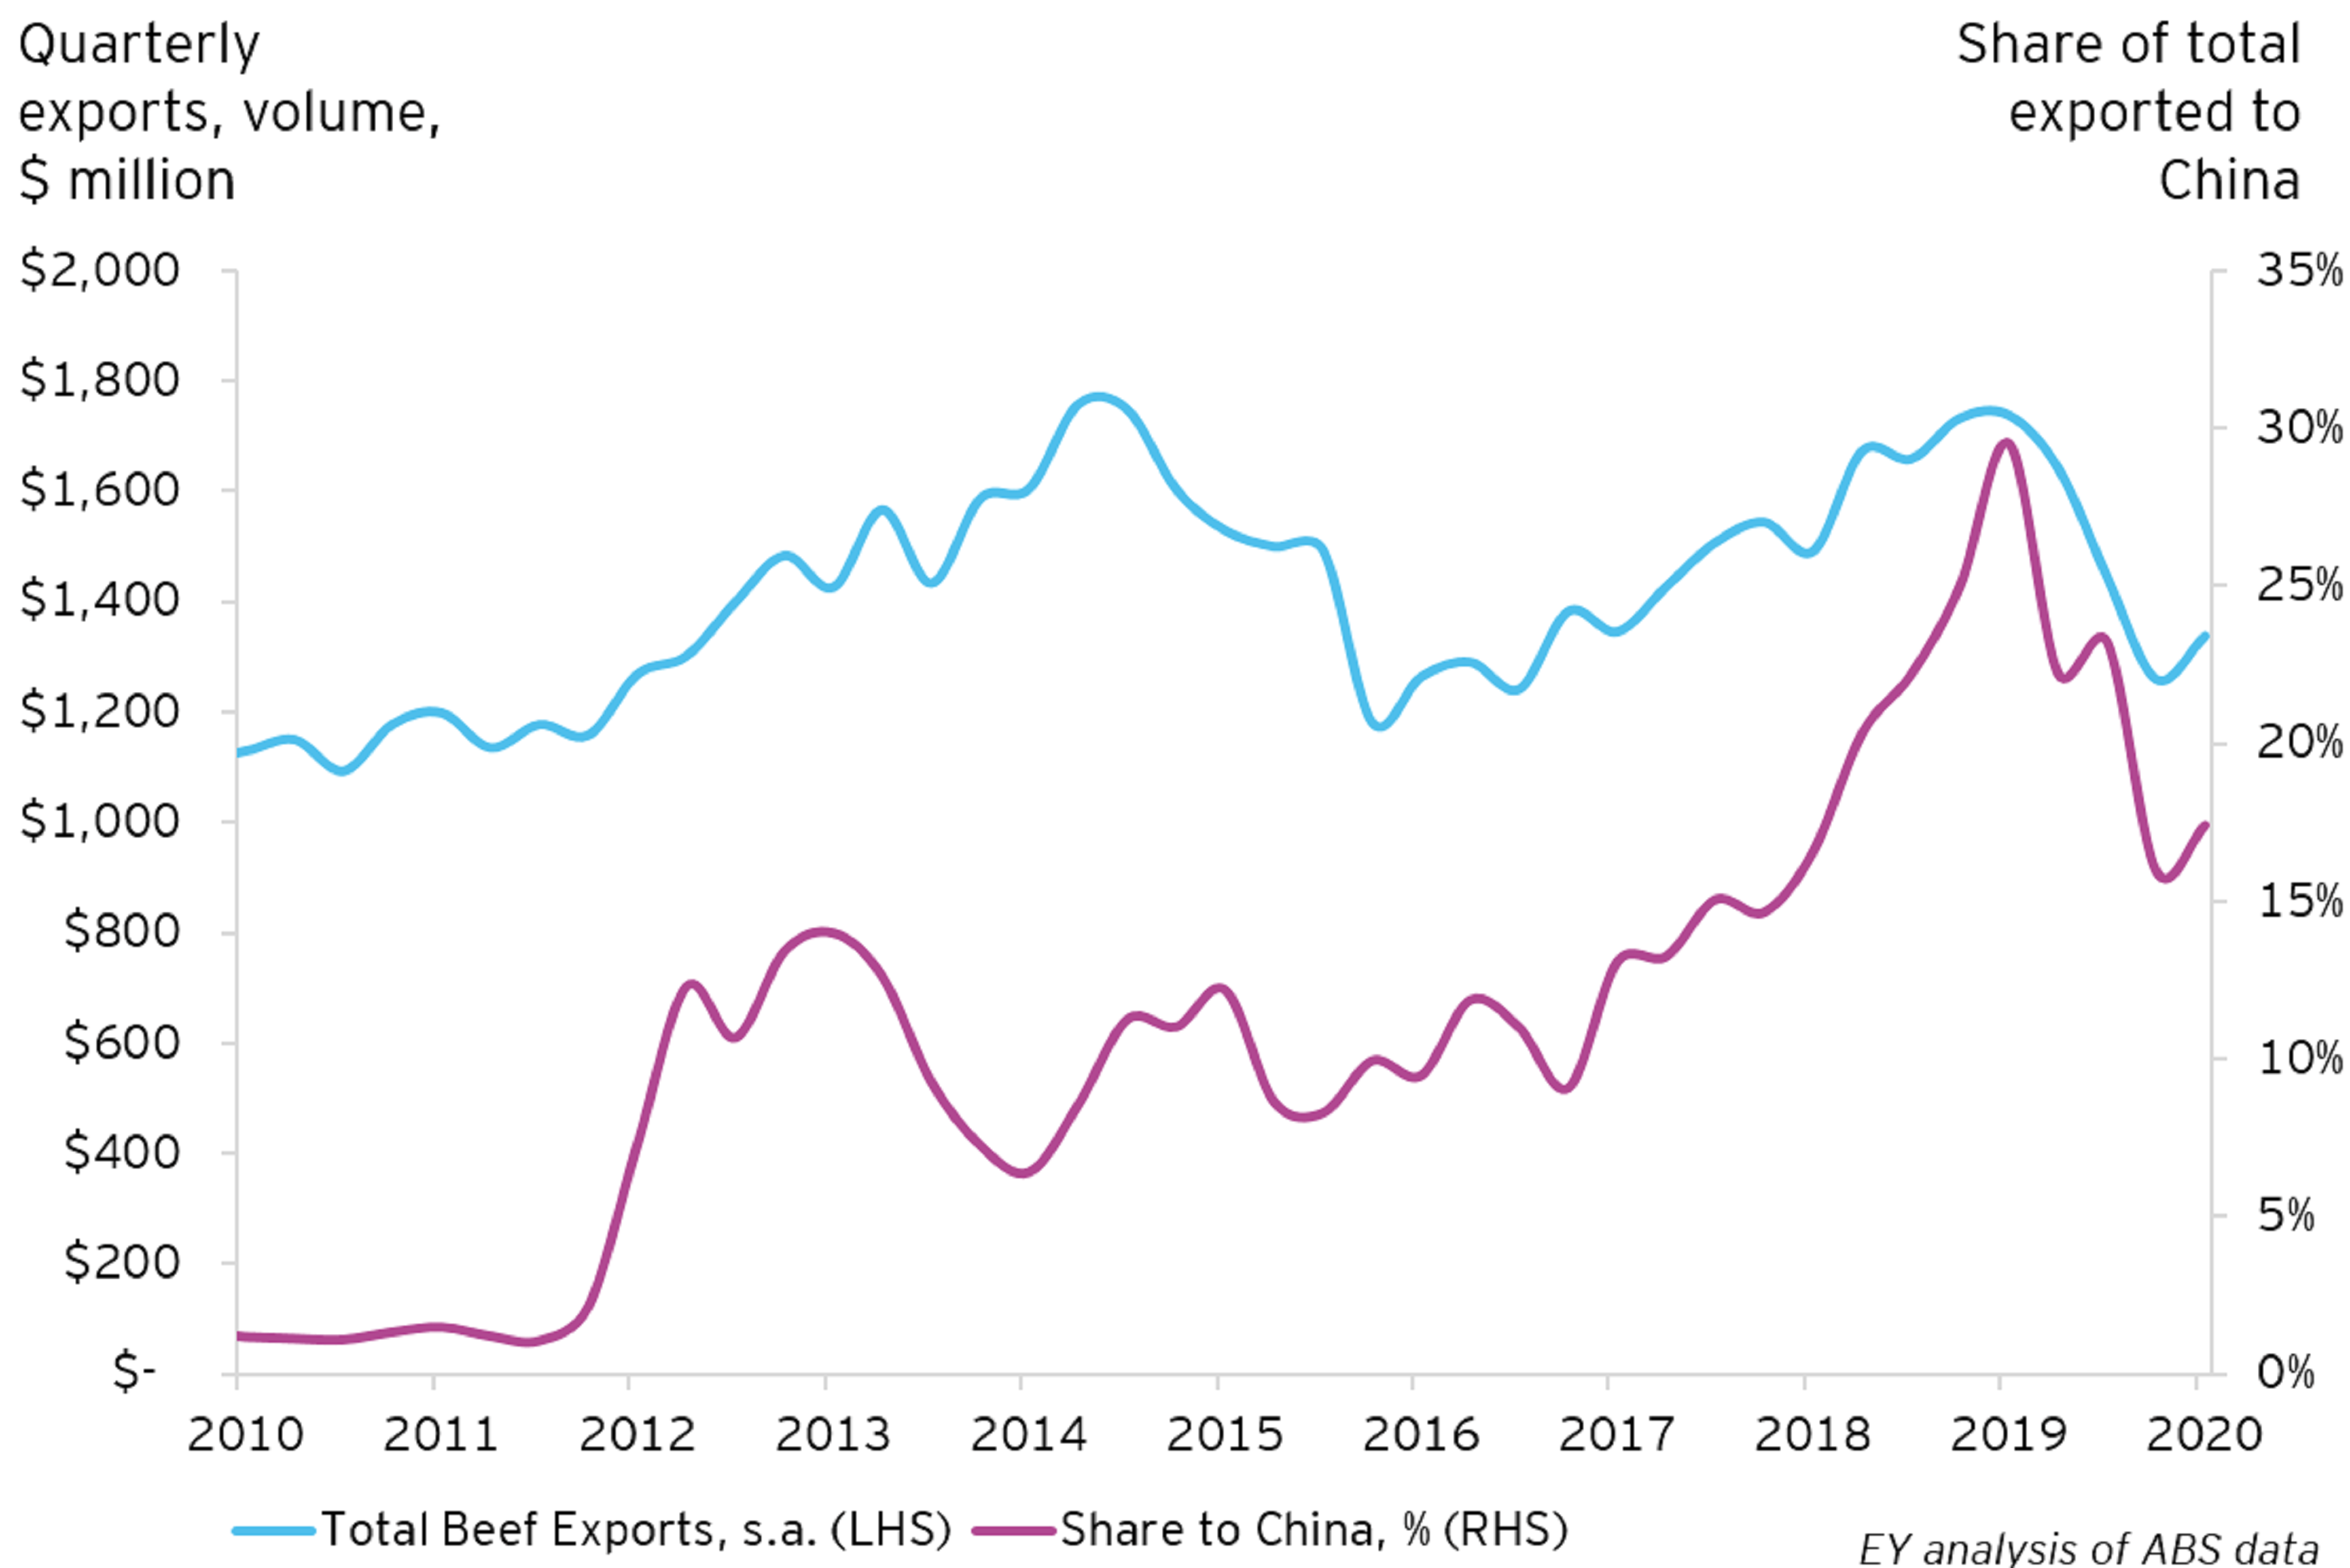
Barley is one of a number of rural goods impacted by Chinese trade tensions. A tariff of 80 per cent has seen the share of Australian Barley exports to China fall from around 60 per cent, to less than 5 per cent this quarter. Encouragingly, barley exporters have managed to find alternative markets, including Japan, Saudi Arabia and Thailand.
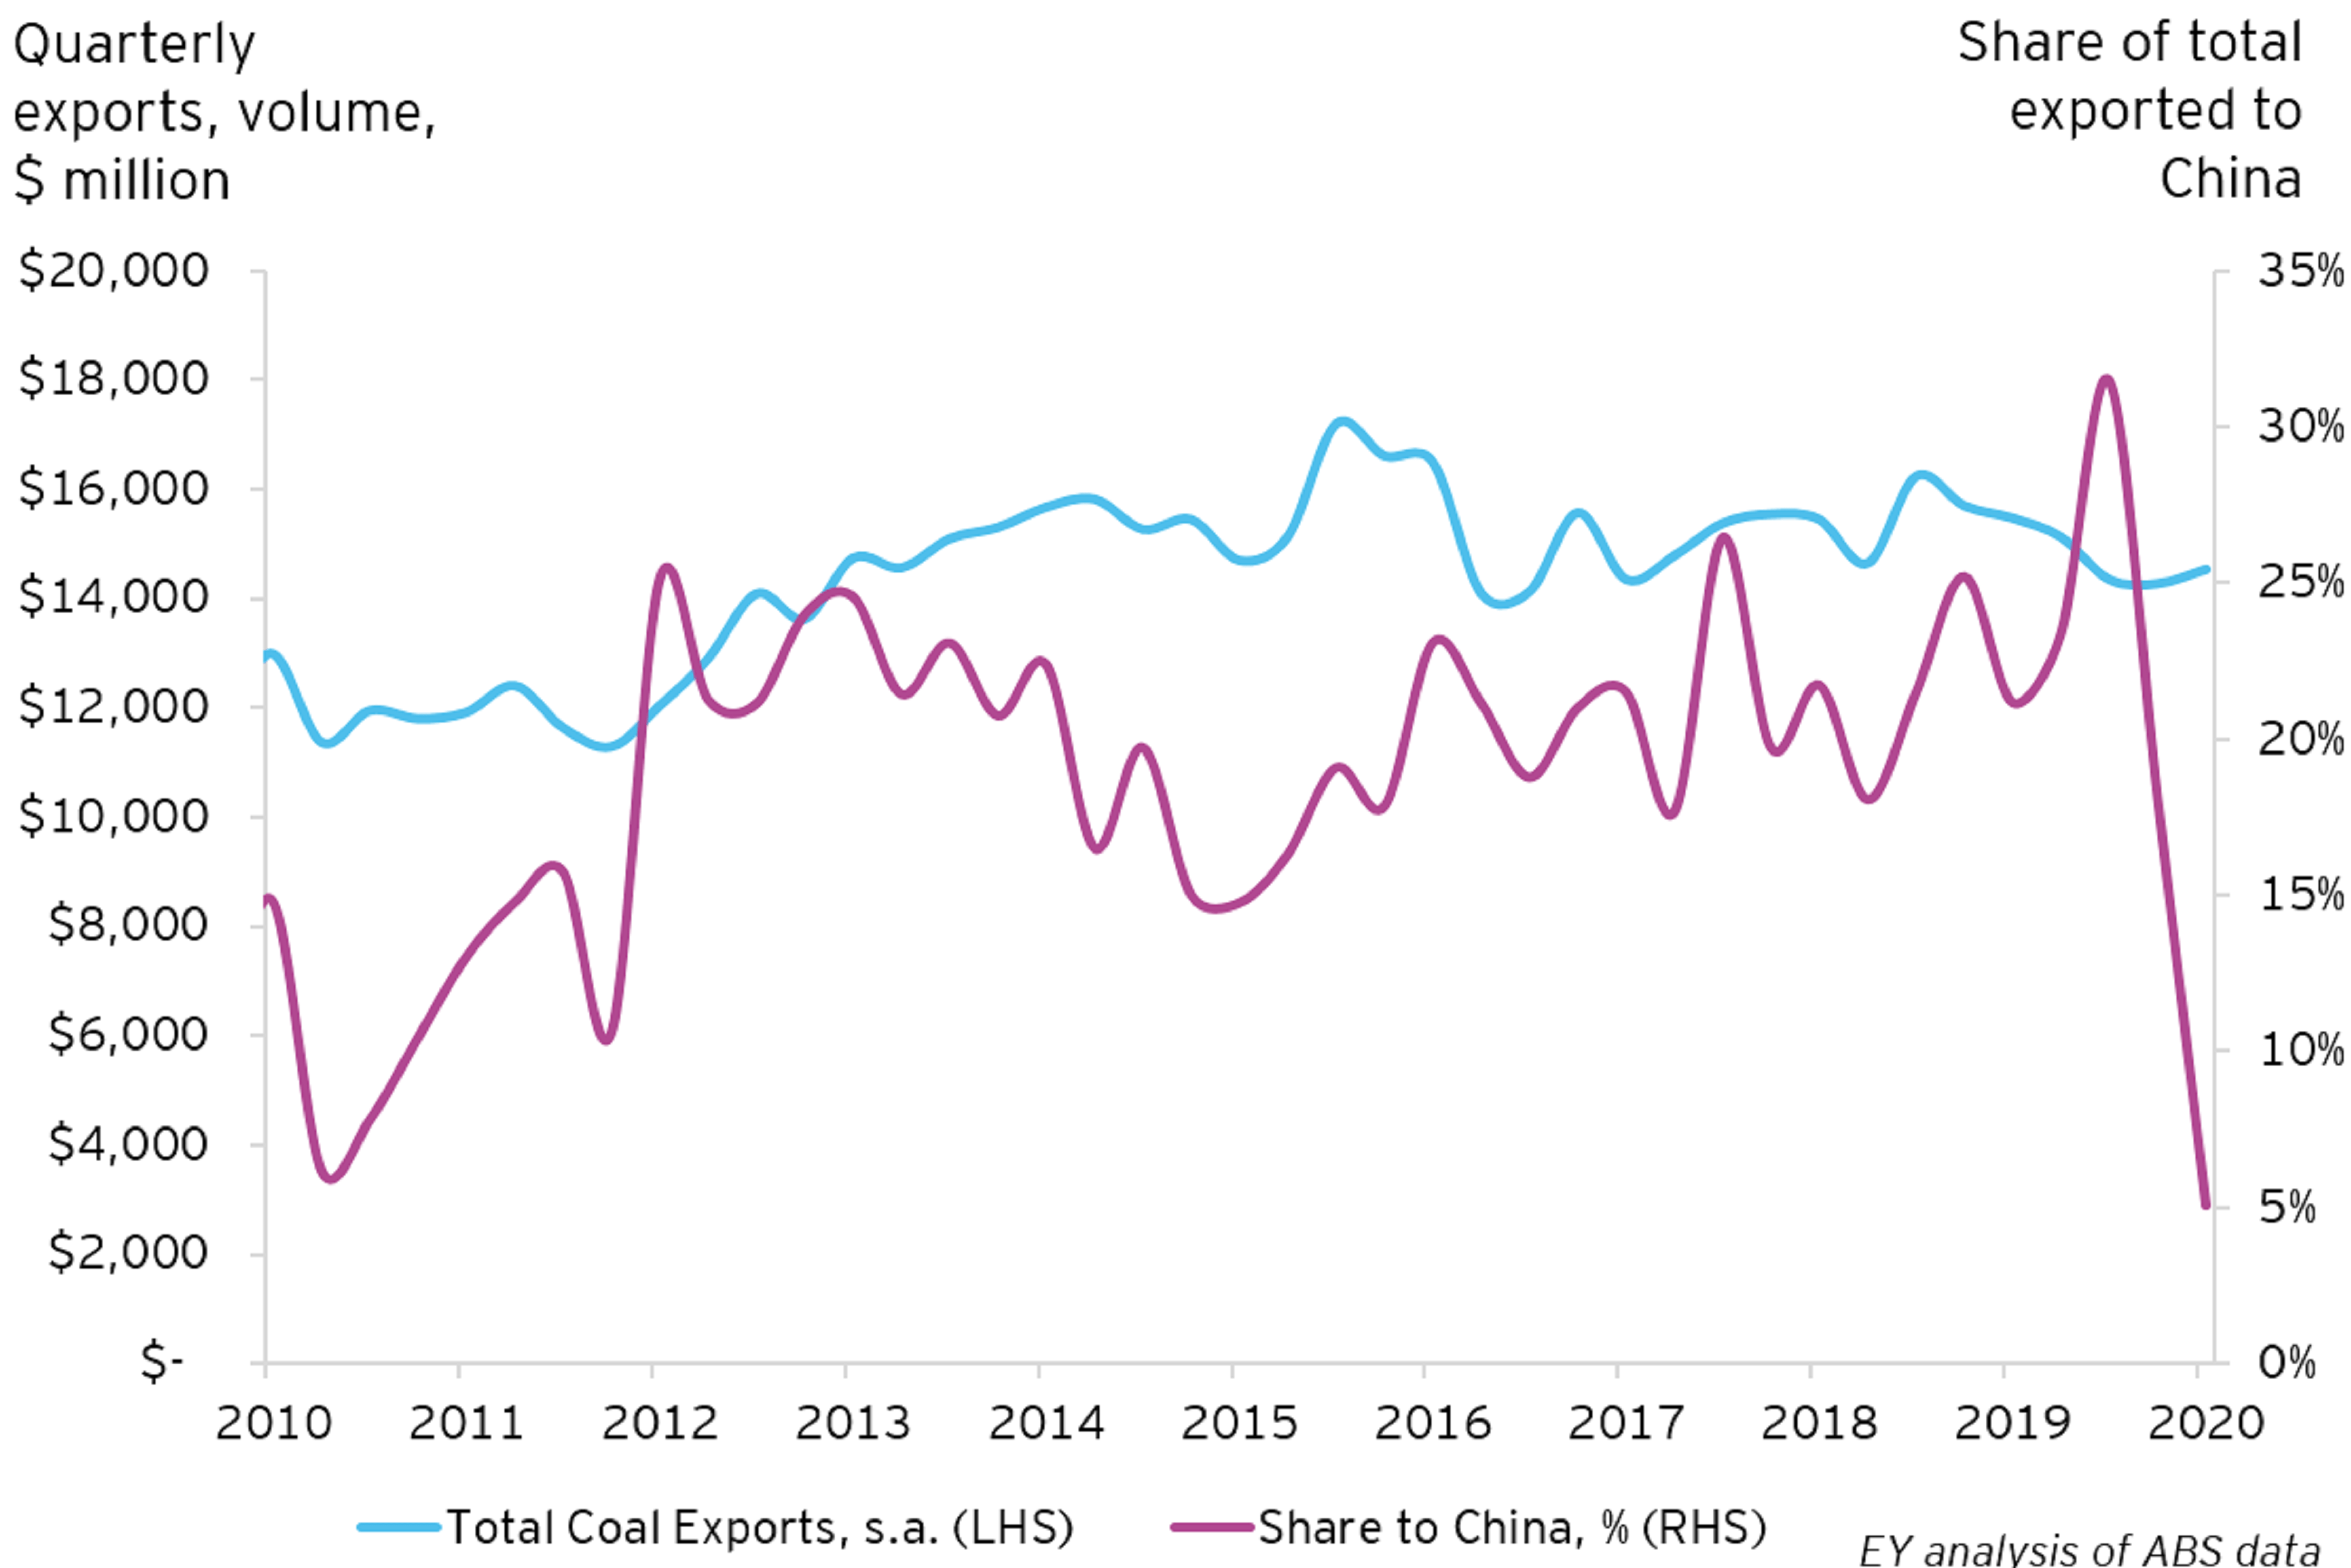
Other commodities impacted by trade tensions with China include Lobsters, Beef and Coal (see charts below). With the exception of lobsters where volumes have fallen sharply, Australian sellers have been able to redirect to other markets. Broadening of Australia’s export relationships will ultimately reduce the economy’s vulnerability to external shocks in the future.
Exports impacted by trade tensions, but alternate markets found
Service exports - which includes education and tourism - rose a modest 1.2 per cent in the quarter but remain 42.2 per cent below pre-COVID levels. Service exports are unlikely to recover until the international border reopens, which is likely to be next year but remains dependent on a range of factors including global management of the virus and the vaccine roll out.
The recovery in the domestic economy is driving a lift in import volumes, which rose by 4.9 per cent in the December quarter, underpinned by a 10.1 per cent rise in imports of consumer goods and a 9.1 per cent rise for capital goods. With the domestic economic recovery being powered by household spending, there continues to be strong import growth for cars and other household vehicles, which are now back at pre-COVID levels, as well as Textiles, Clothing & Footwear, which have risen to record levels.
It is encouraging to see another rise in imports of capital goods, which have now risen by 22.5 per cent over the past 2 quarters, driven by substantial increases in Machinery & Equipment and Industrial Transport Equipment, both of which hit record highs in the December quarter. These increases are consistent with Government policies to encourage investment such as the instant asset write of scheme. It will be important to continue to monitor these imports as these tax incentives come to an end, as they tend to encourage a bring forward of investment, rather than lead to a long-term lift.
Dwelling Investment
This is the first time since mid-2018 new dwelling investment contributes to growth
Dwelling investment increased by 4.1 per cent in the quarter, contributing to economic growth for the second consecutive quarter.
Dwelling investment increased by 4.1 per cent in the quarter, contributing to economic growth for the second consecutive quarter, as both renovations and new dwelling investment rose. This is the first time since mid-2018 where new dwelling investment has risen. Government policy including the Federal Government’s HomeBuilder scheme, accompanying State building policies and low interest rates has helped fuel the rise.
The uplift in new dwelling investment was particularly large in Tasmania, Queensland and Western Australia, where quarterly growth was 10.7 per cent, 10.1 per cent and 7.6 per cent respectively. While investment was unchanged or went modestly backwards in New South Wales, South Australia and the ACT.
Strong momentum in the renovations sector continued into the December quarter, as alterations and additions grew rapidly for the second consecutive quarter. Over the past 6 months this sector of the economy has grown by 13.3 per cent, with growth seen in all states bar Victoria and the Northern Territory.
Dwelling construction follows booming approvals, but uncertainty ahead
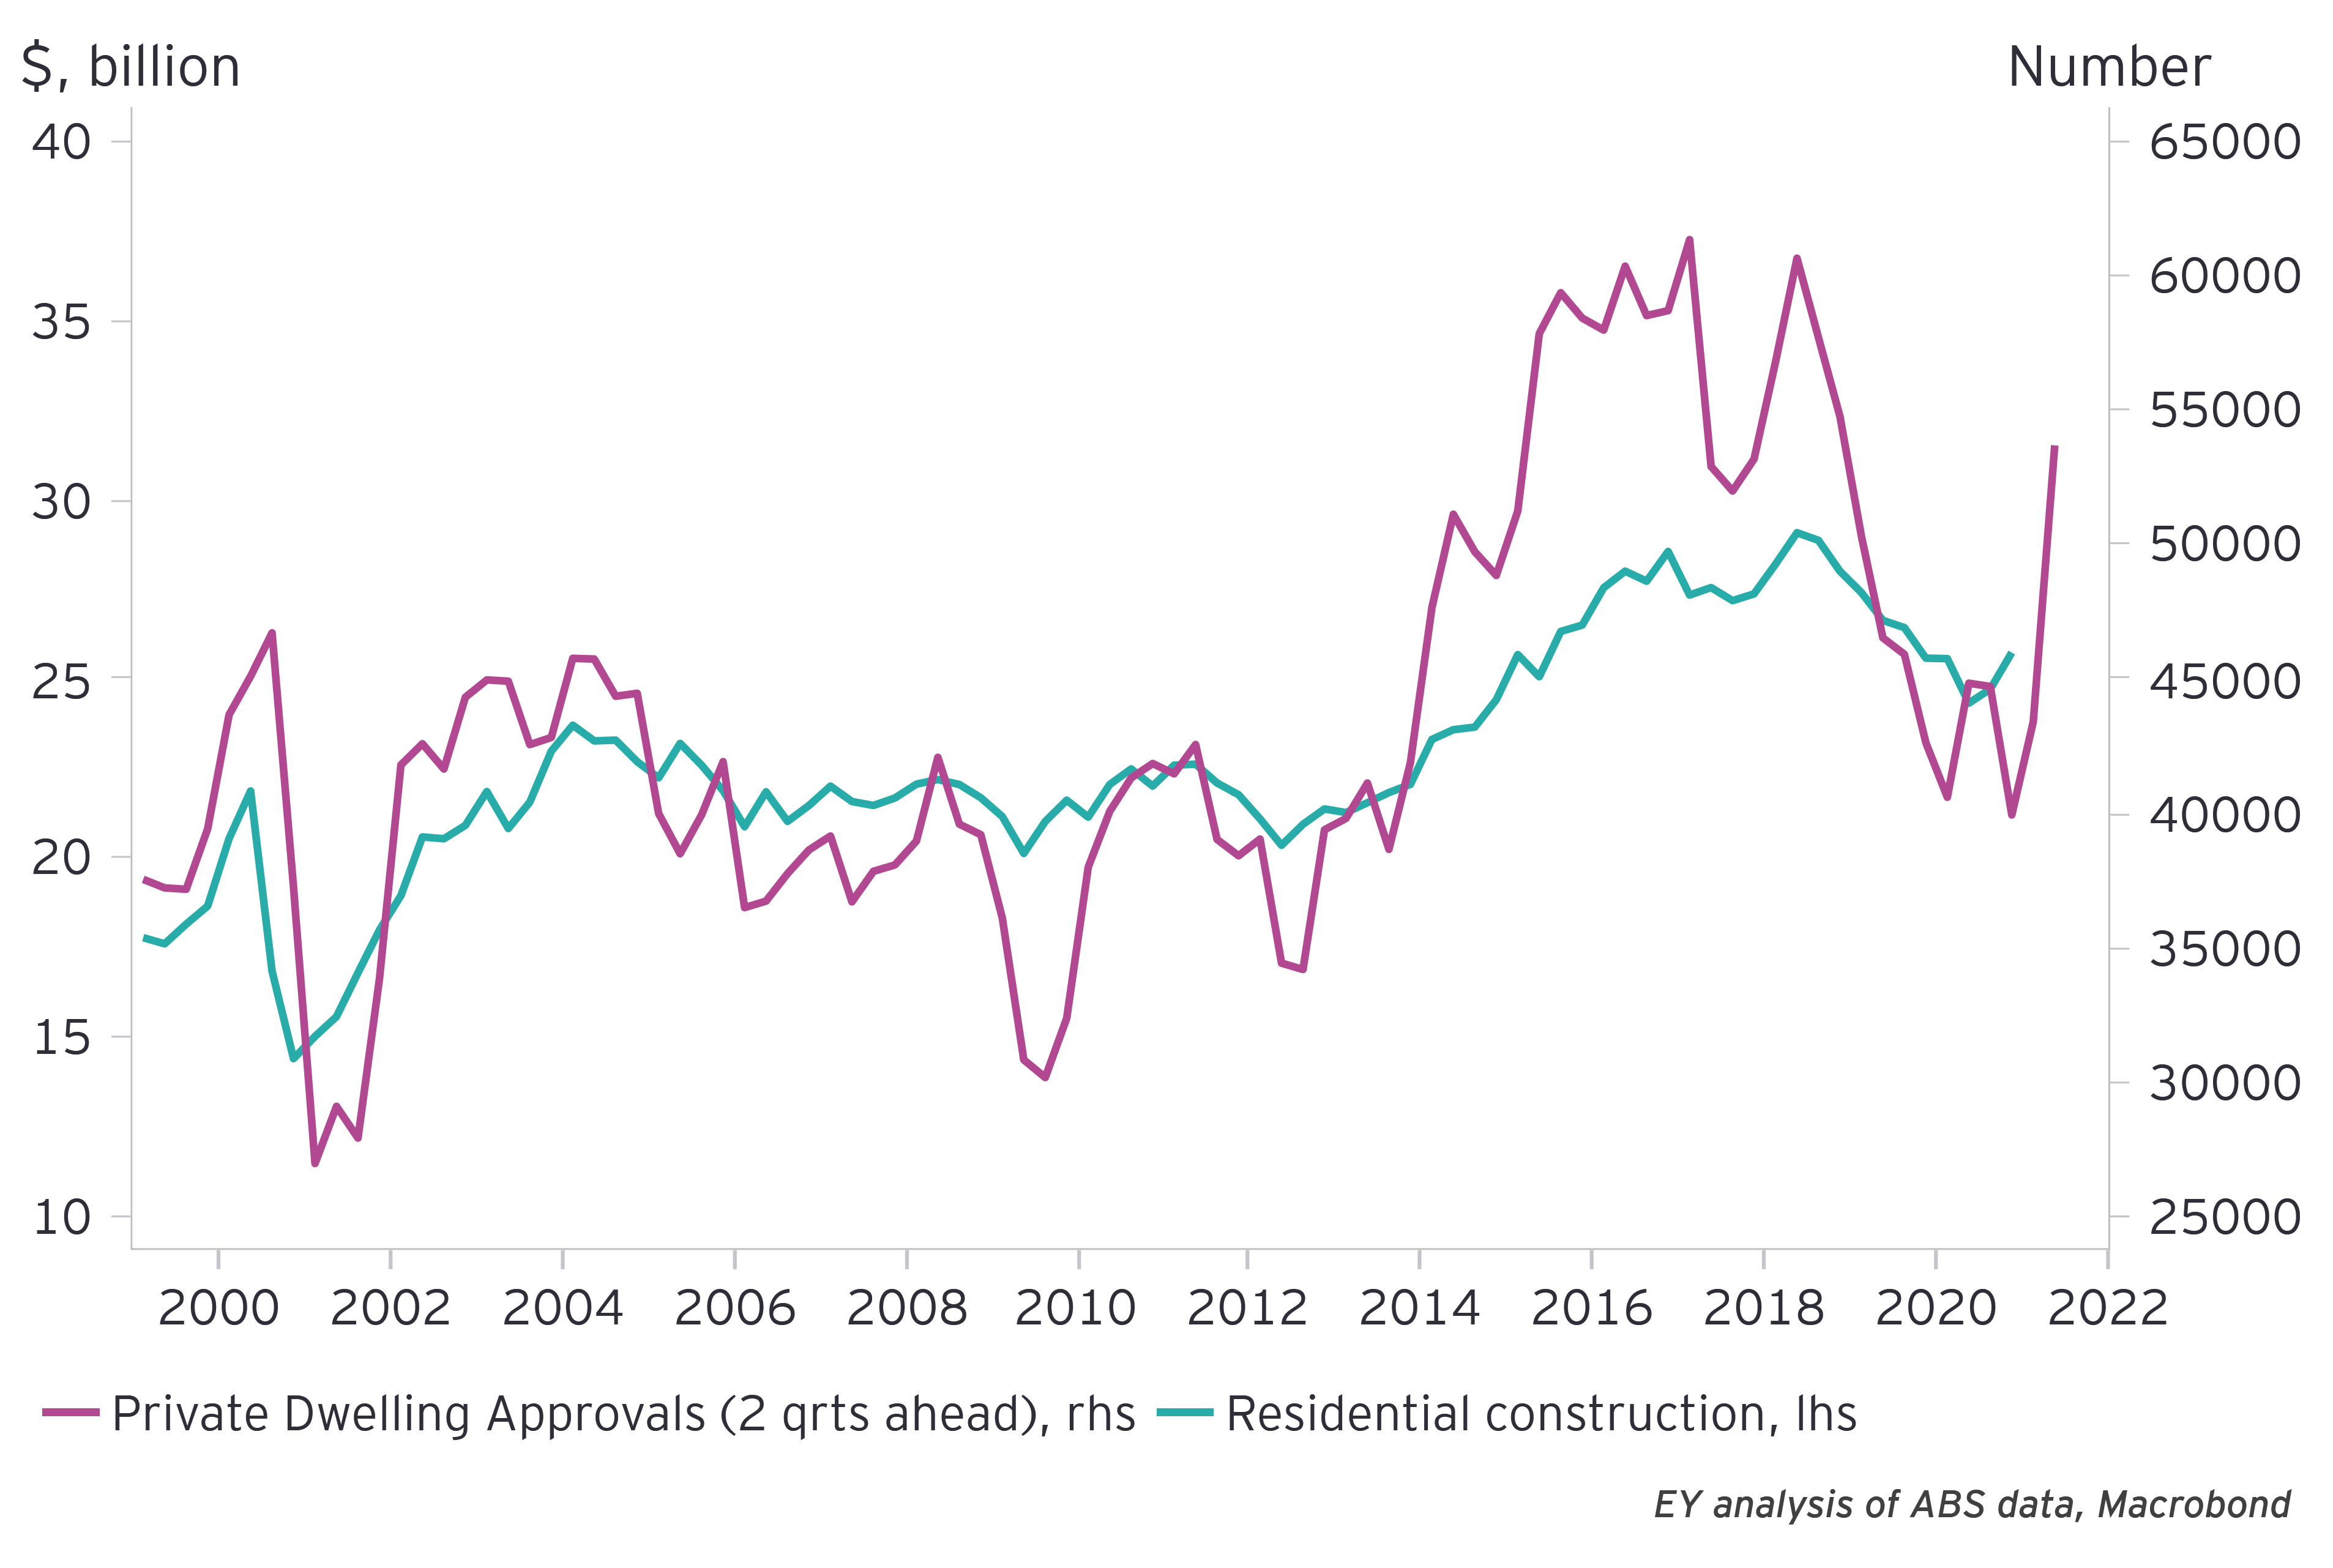
There is some uncertainty ahead for the sector, policies like Homebuilder tend to bring forward investment rather generate a sustained lift. Indeed, after surging to record levels in December, new private dwelling approvals fell a sharp 19.4 per cent in January alongside the lower grant amount. HomeBuilder is scheduled to end on 31 March which could see a weaker second half of the year for this sector.
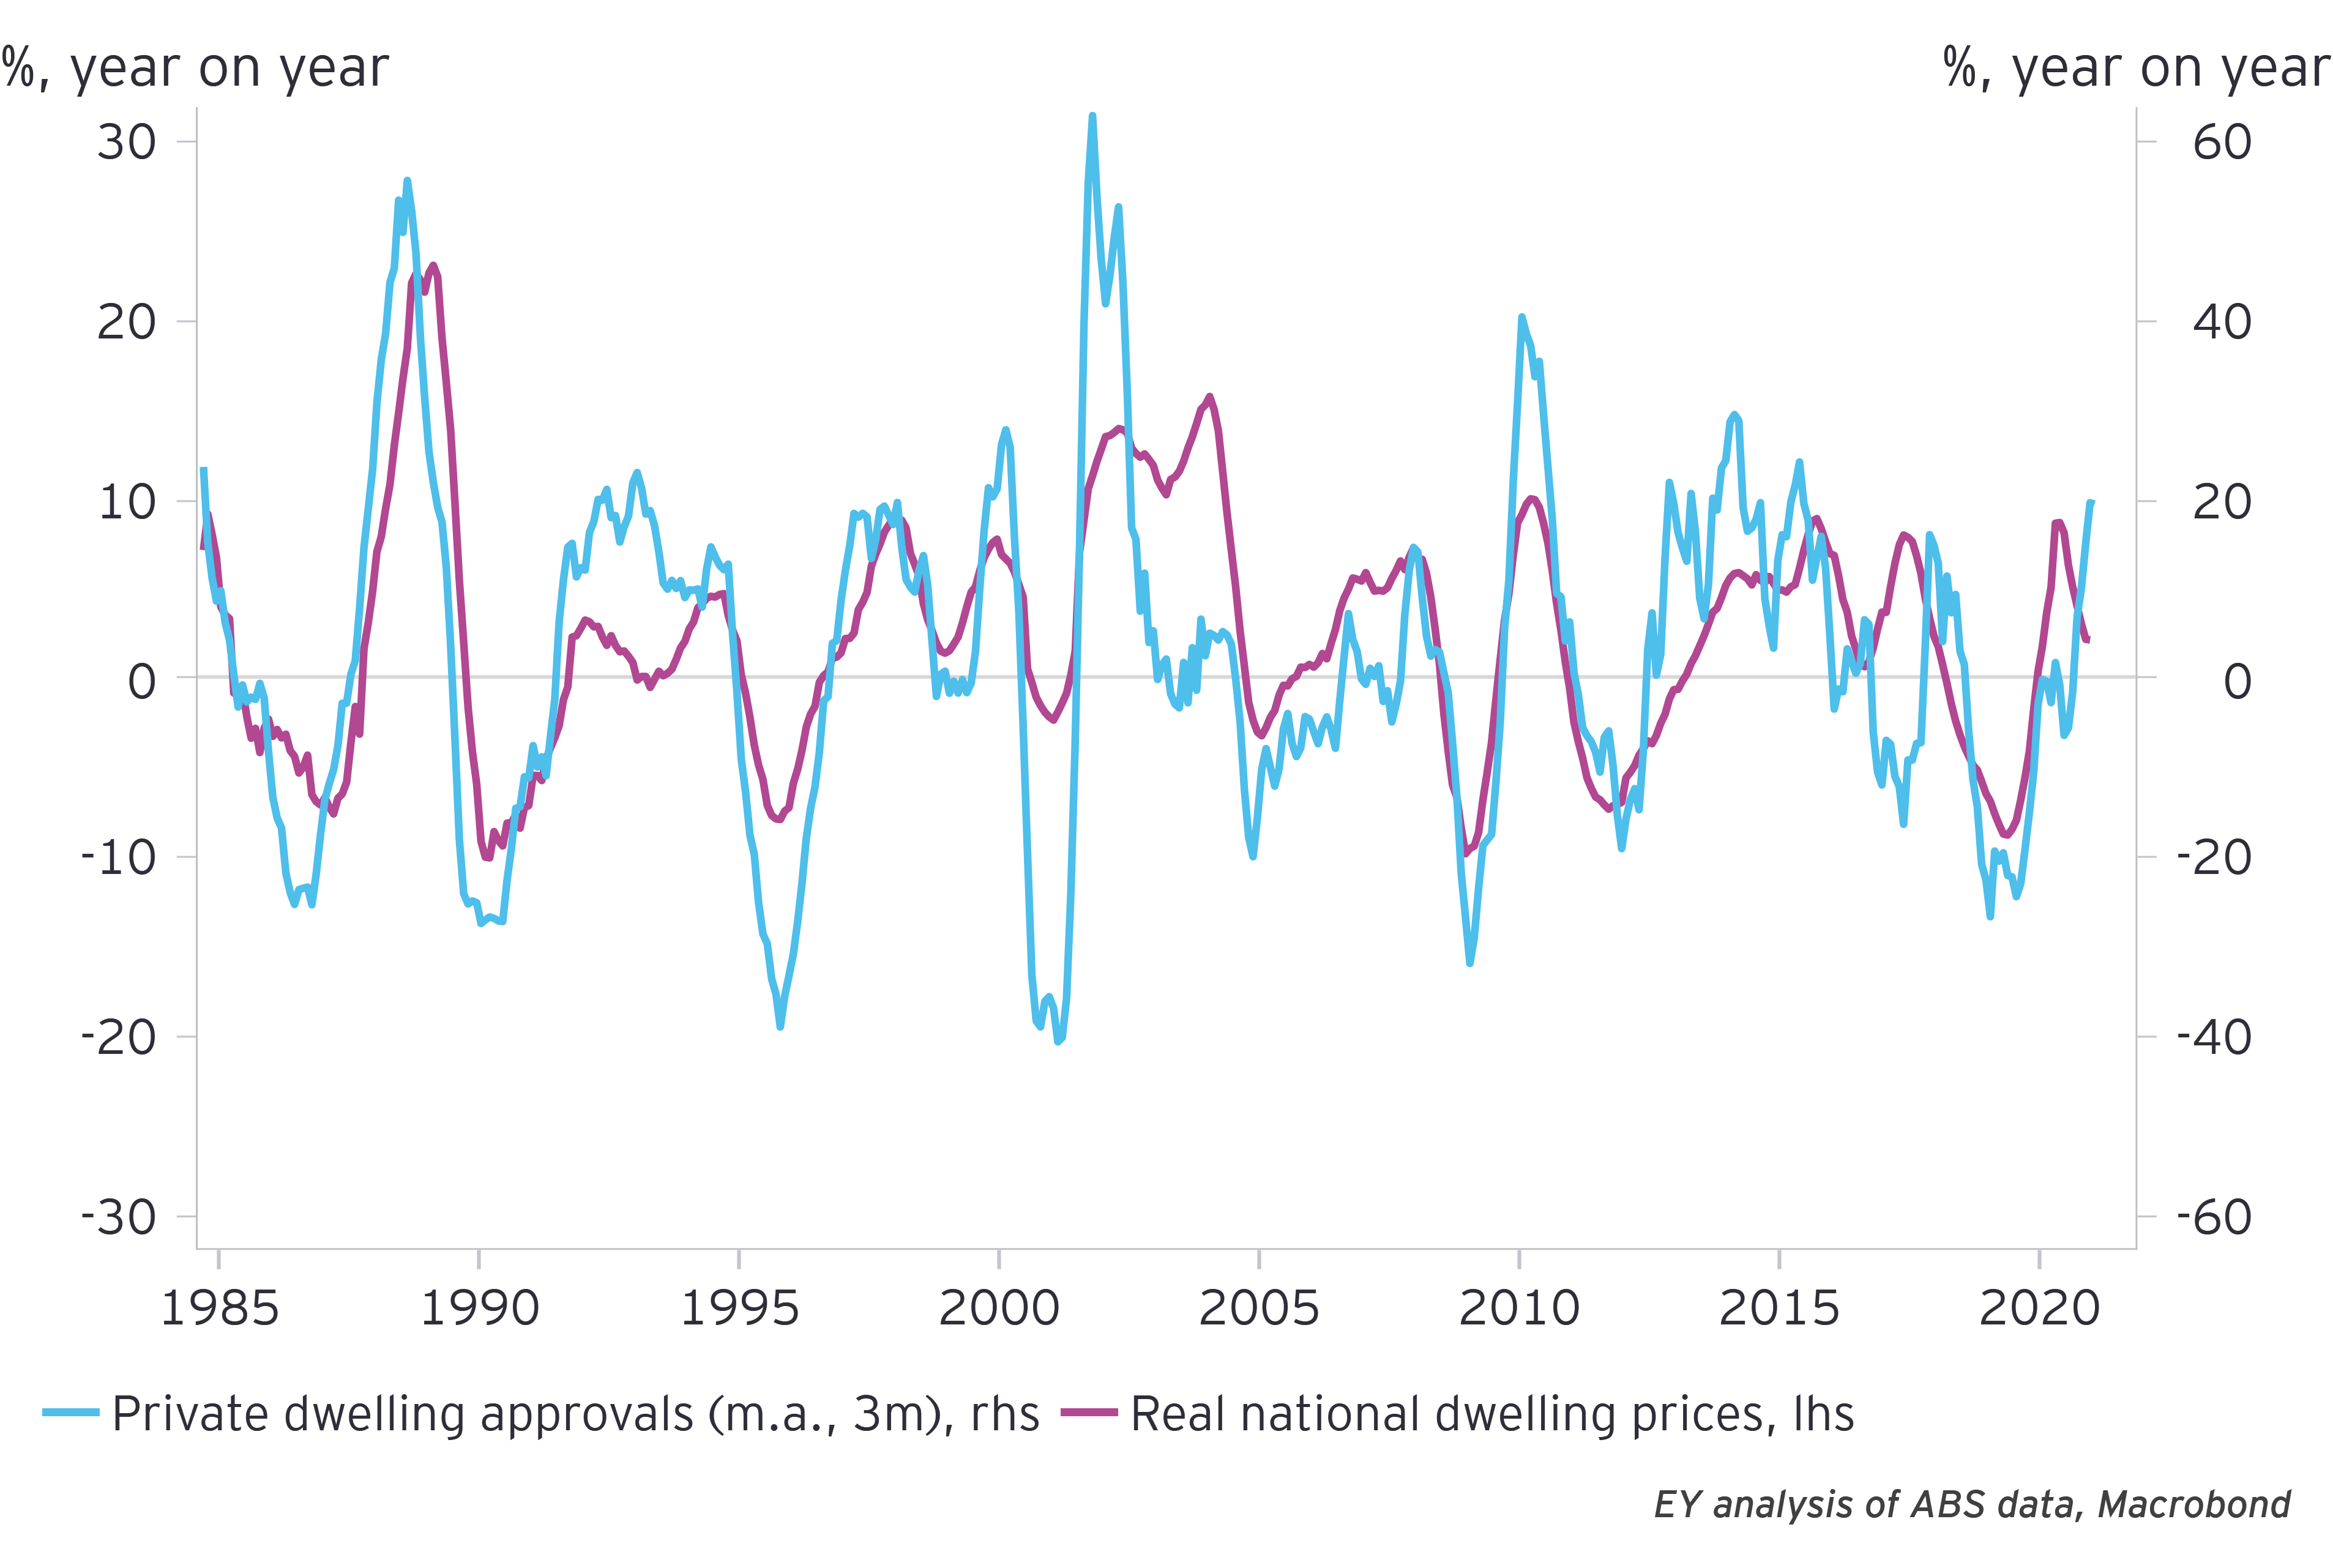
On the other hand, providing support to dwelling construction are rising house prices, which in February rose at the fastest rate in 17 years. Historical relationships suggest a 1 per cent permanent increase in real house prices leads to around a 0.5 per cent increase building approvals. The question remains if the recent rise in house prices will be enough to offset a decline in building approvals following the ending of HomeBuilder, given that weak population growth and high residential vacancy rates in Australia’s largest cities are likely to weigh on demand for new housing.
Dwelling approvals follow prices, but is recent price momentum enough?

Business Investment
Near term strength but uncertainty clouds the outlook
Economic growth has also broadened to include business investment for the first time since early 2019.
Economic growth has also broadened to include business investment. For the first time since March 2019 underlying business investment made a positive contribution to economic growth, increasing by 2.6 per cent in the quarter. In year on year terms, however, business investment remains weak, down 5.1 per cent. Business investment now hasn’t recorded a positive annual increase since June 2018 – highlighting just how weak business investment was prior to COVID-19.
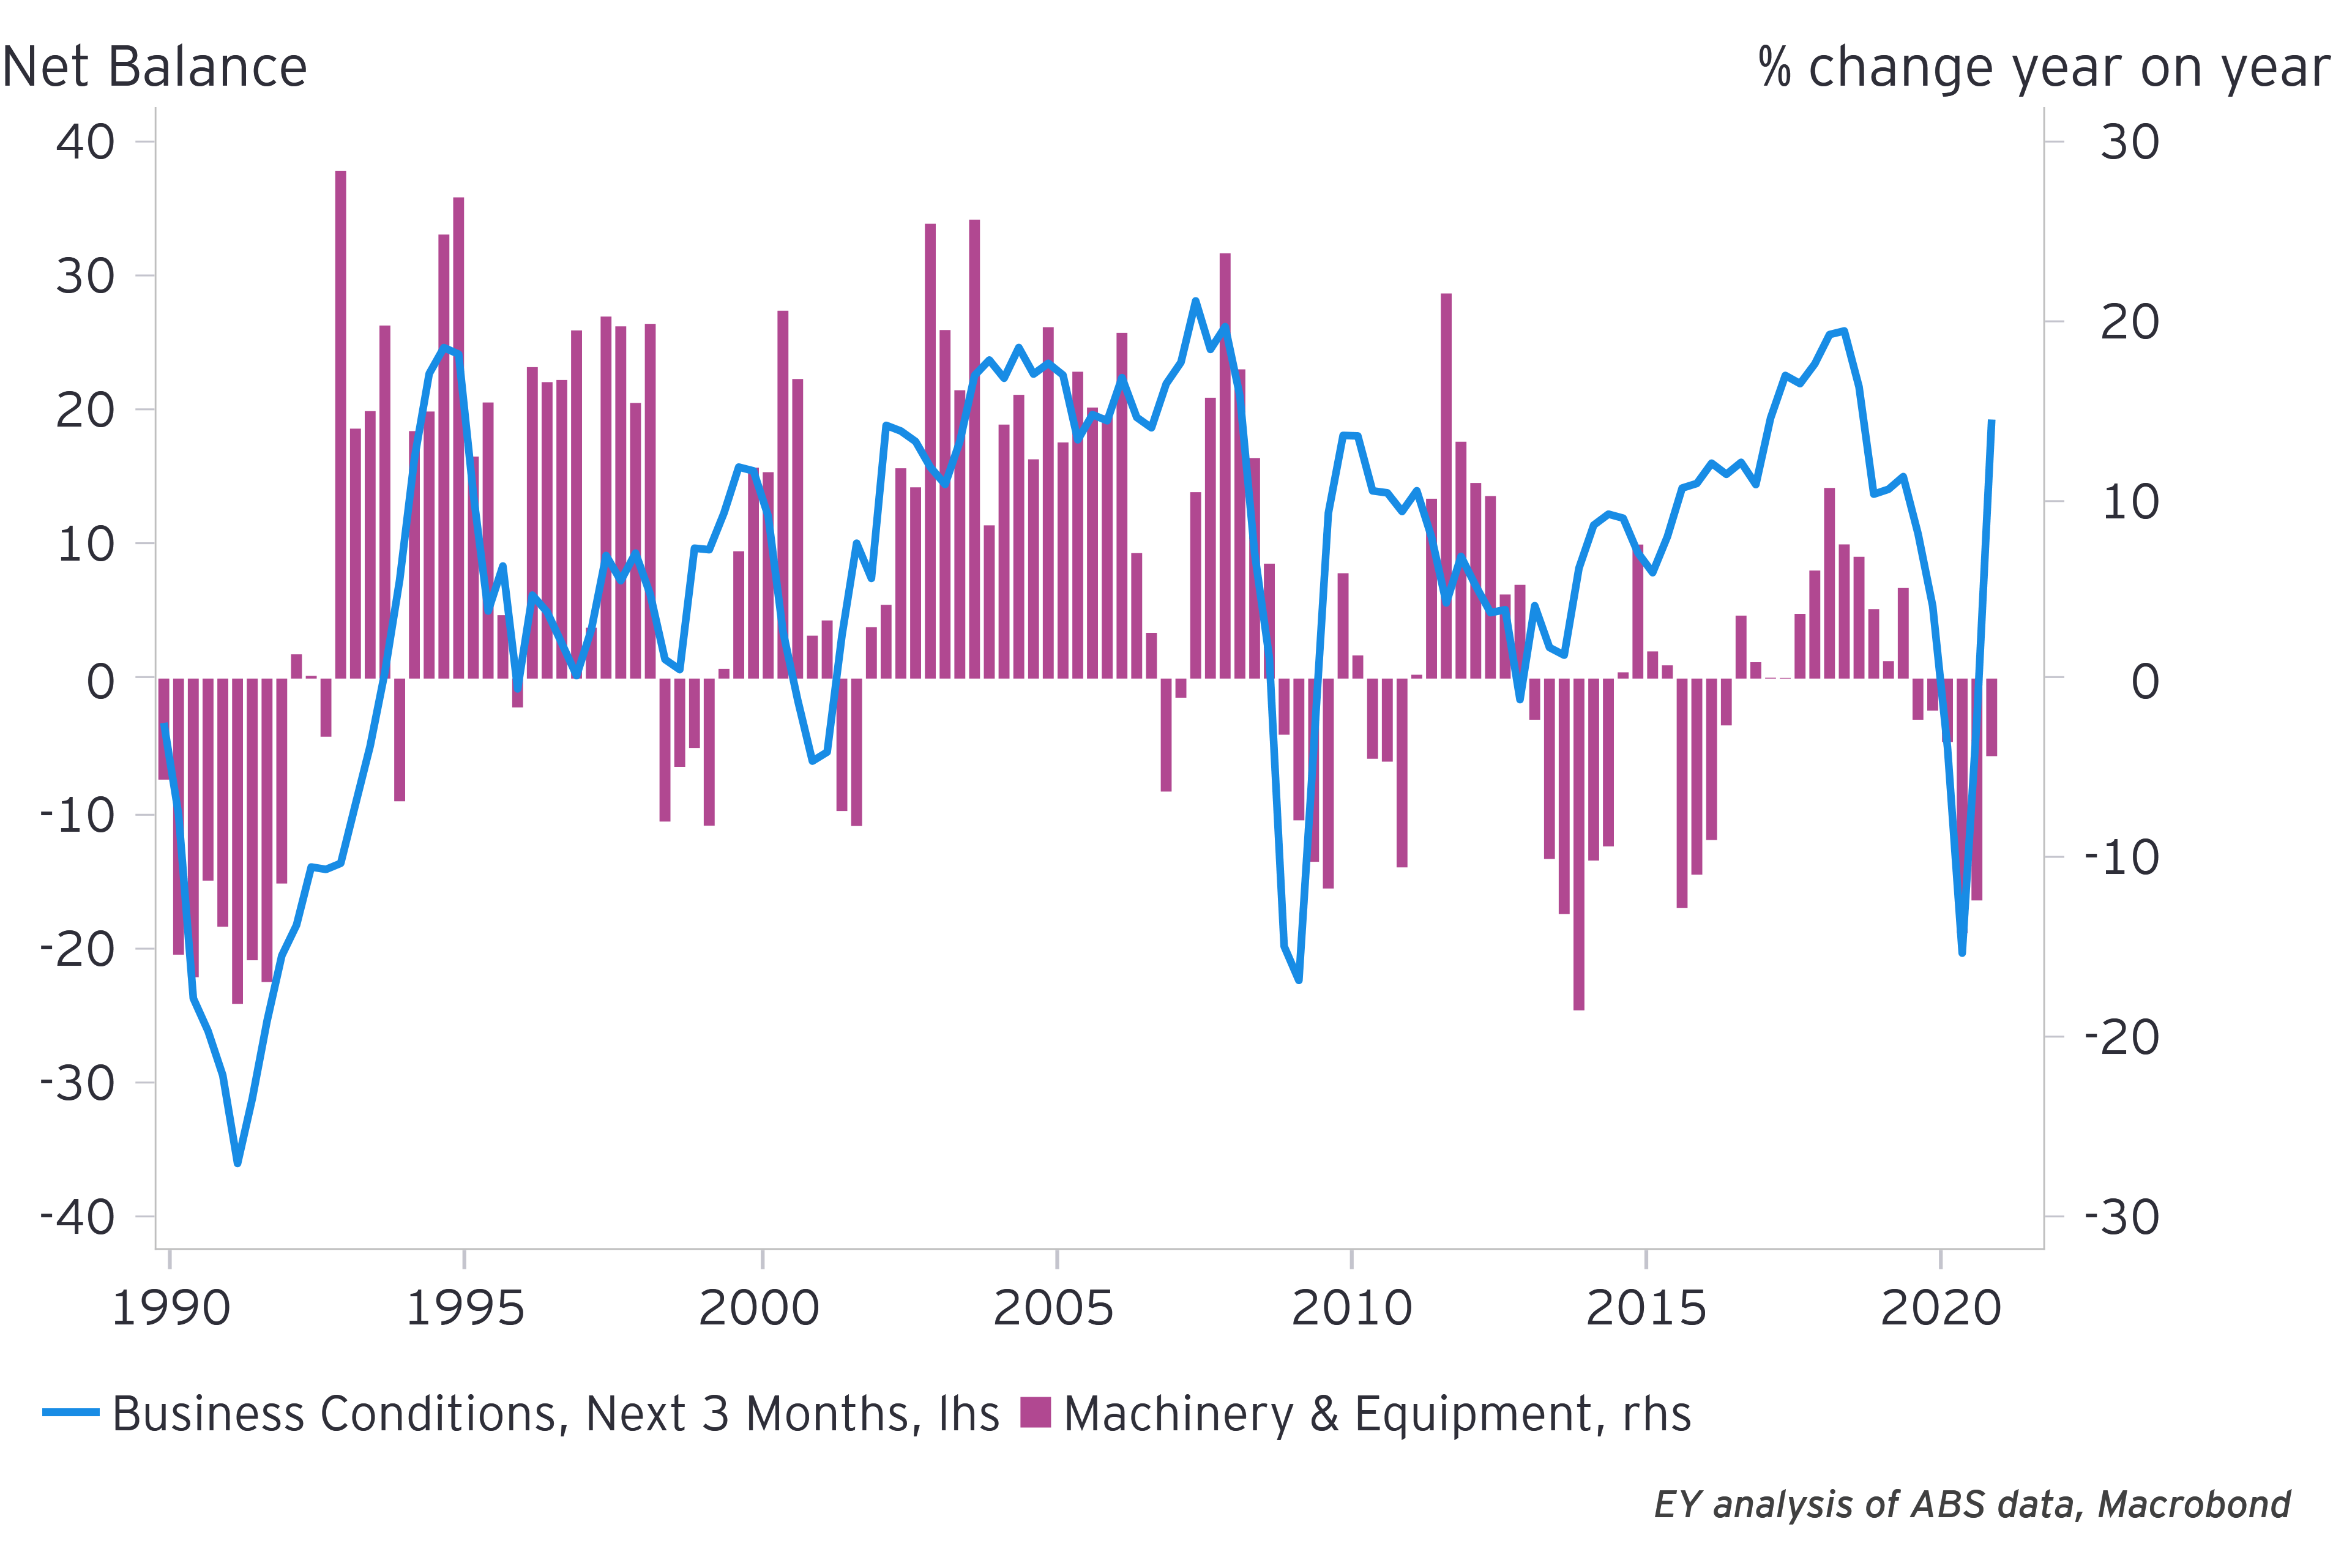
The quarterly acceleration was led by a surge in machinery and equipment investment which rose 8.9 per cent in the quarter, consistent with a 20 per cent increase in capital imports over the past two quarters. The Federal Government’s accelerated depreciation and instant asset write-off scheme are clearly having an impact here, but so are improving business conditions. Corporate profits are 9.8 per cent higher than a year ago, interest rates are at record low levels and there is growing optimism in regard to controlling the virus. Machinery and equipment investment tends to be more sensitive than other forms of investment to changes in business conditions.
There is a question as to how long this can be sustained. Policy incentives such as the instant asset write-off scheme tend to largely bring forward investment, boosting economic activity now, rather than lifting and sustaining higher overall investment. This was reflected in the latest ABS private capital expenditure survey; machinery investment intentions were revised up by 9.7 per cent for 2020-21 from the last survey but in 2021-22 expectations are particularly weak, 5.7 per cent lower than the comparable estimate from last year (acknowledging that first estimates are often not very accurate).
Machinery and equipment investment tend to move in line with business conditions
Other forms of investment had mixed outcomes. Engineering construction expanded modestly during the quarter to be flat over the year, while spending on intellectual property products, such as R&D, continued to recovery from its earlier fall at the start of the Pandemic, increasing by 1.4 per cent in the quarter. Non-residential building construction on the other hand continues to falter, falling by 2.6 per cent in the quarter - the 5th consecutive quarterly decline. Going forward, non-residential building approvals suggest this sector is likely to continue weighing on economic growth.
Office vacancy rates in Australia’s biggest office markets, Sydney and Melbourne, continue to increase, even as people begin returning to the office. In Sydney the office vacancy reached a 7 year high in January of 8.6 per cent, up from 3.9 per cent a year ago. The Property Council’s survey of capital growth expectations in the office market over the next 12 months showed a net balance of -41, as most respondents reported a negative outlook for the sector. Consistent with these conditions, leading indicators of non-residential construction, such as building approvals continue to fall. Over the past year the value of non-residential building approvals have fallen by nearly 20 per cent – with offices and short-term accommodation leading the declines.
A high level of uncertainty is likely to continue to weigh on investment in the medium term with 11 out of the 17 industries surveyed in the ABS private capital expenditure survey expecting investment in 2021-22 to be lower than a comparable estimate last year. EY’s latest Capital Confidence Barometer (CCB) supports the modest medium-term investment outlook, with 8 out of 10 respondents in Oceania reporting delaying planned investment due to geopolitical uncertainties. These uncertainties appear to be overwhelming the generally favourable investment climate – with low interest rates, rising profitability, access to capital, and an improving economy.

Economic activity by industry
Economic recovery is becoming more even across industries
A rebound in the services sector and a bumper quarter for agriculture.
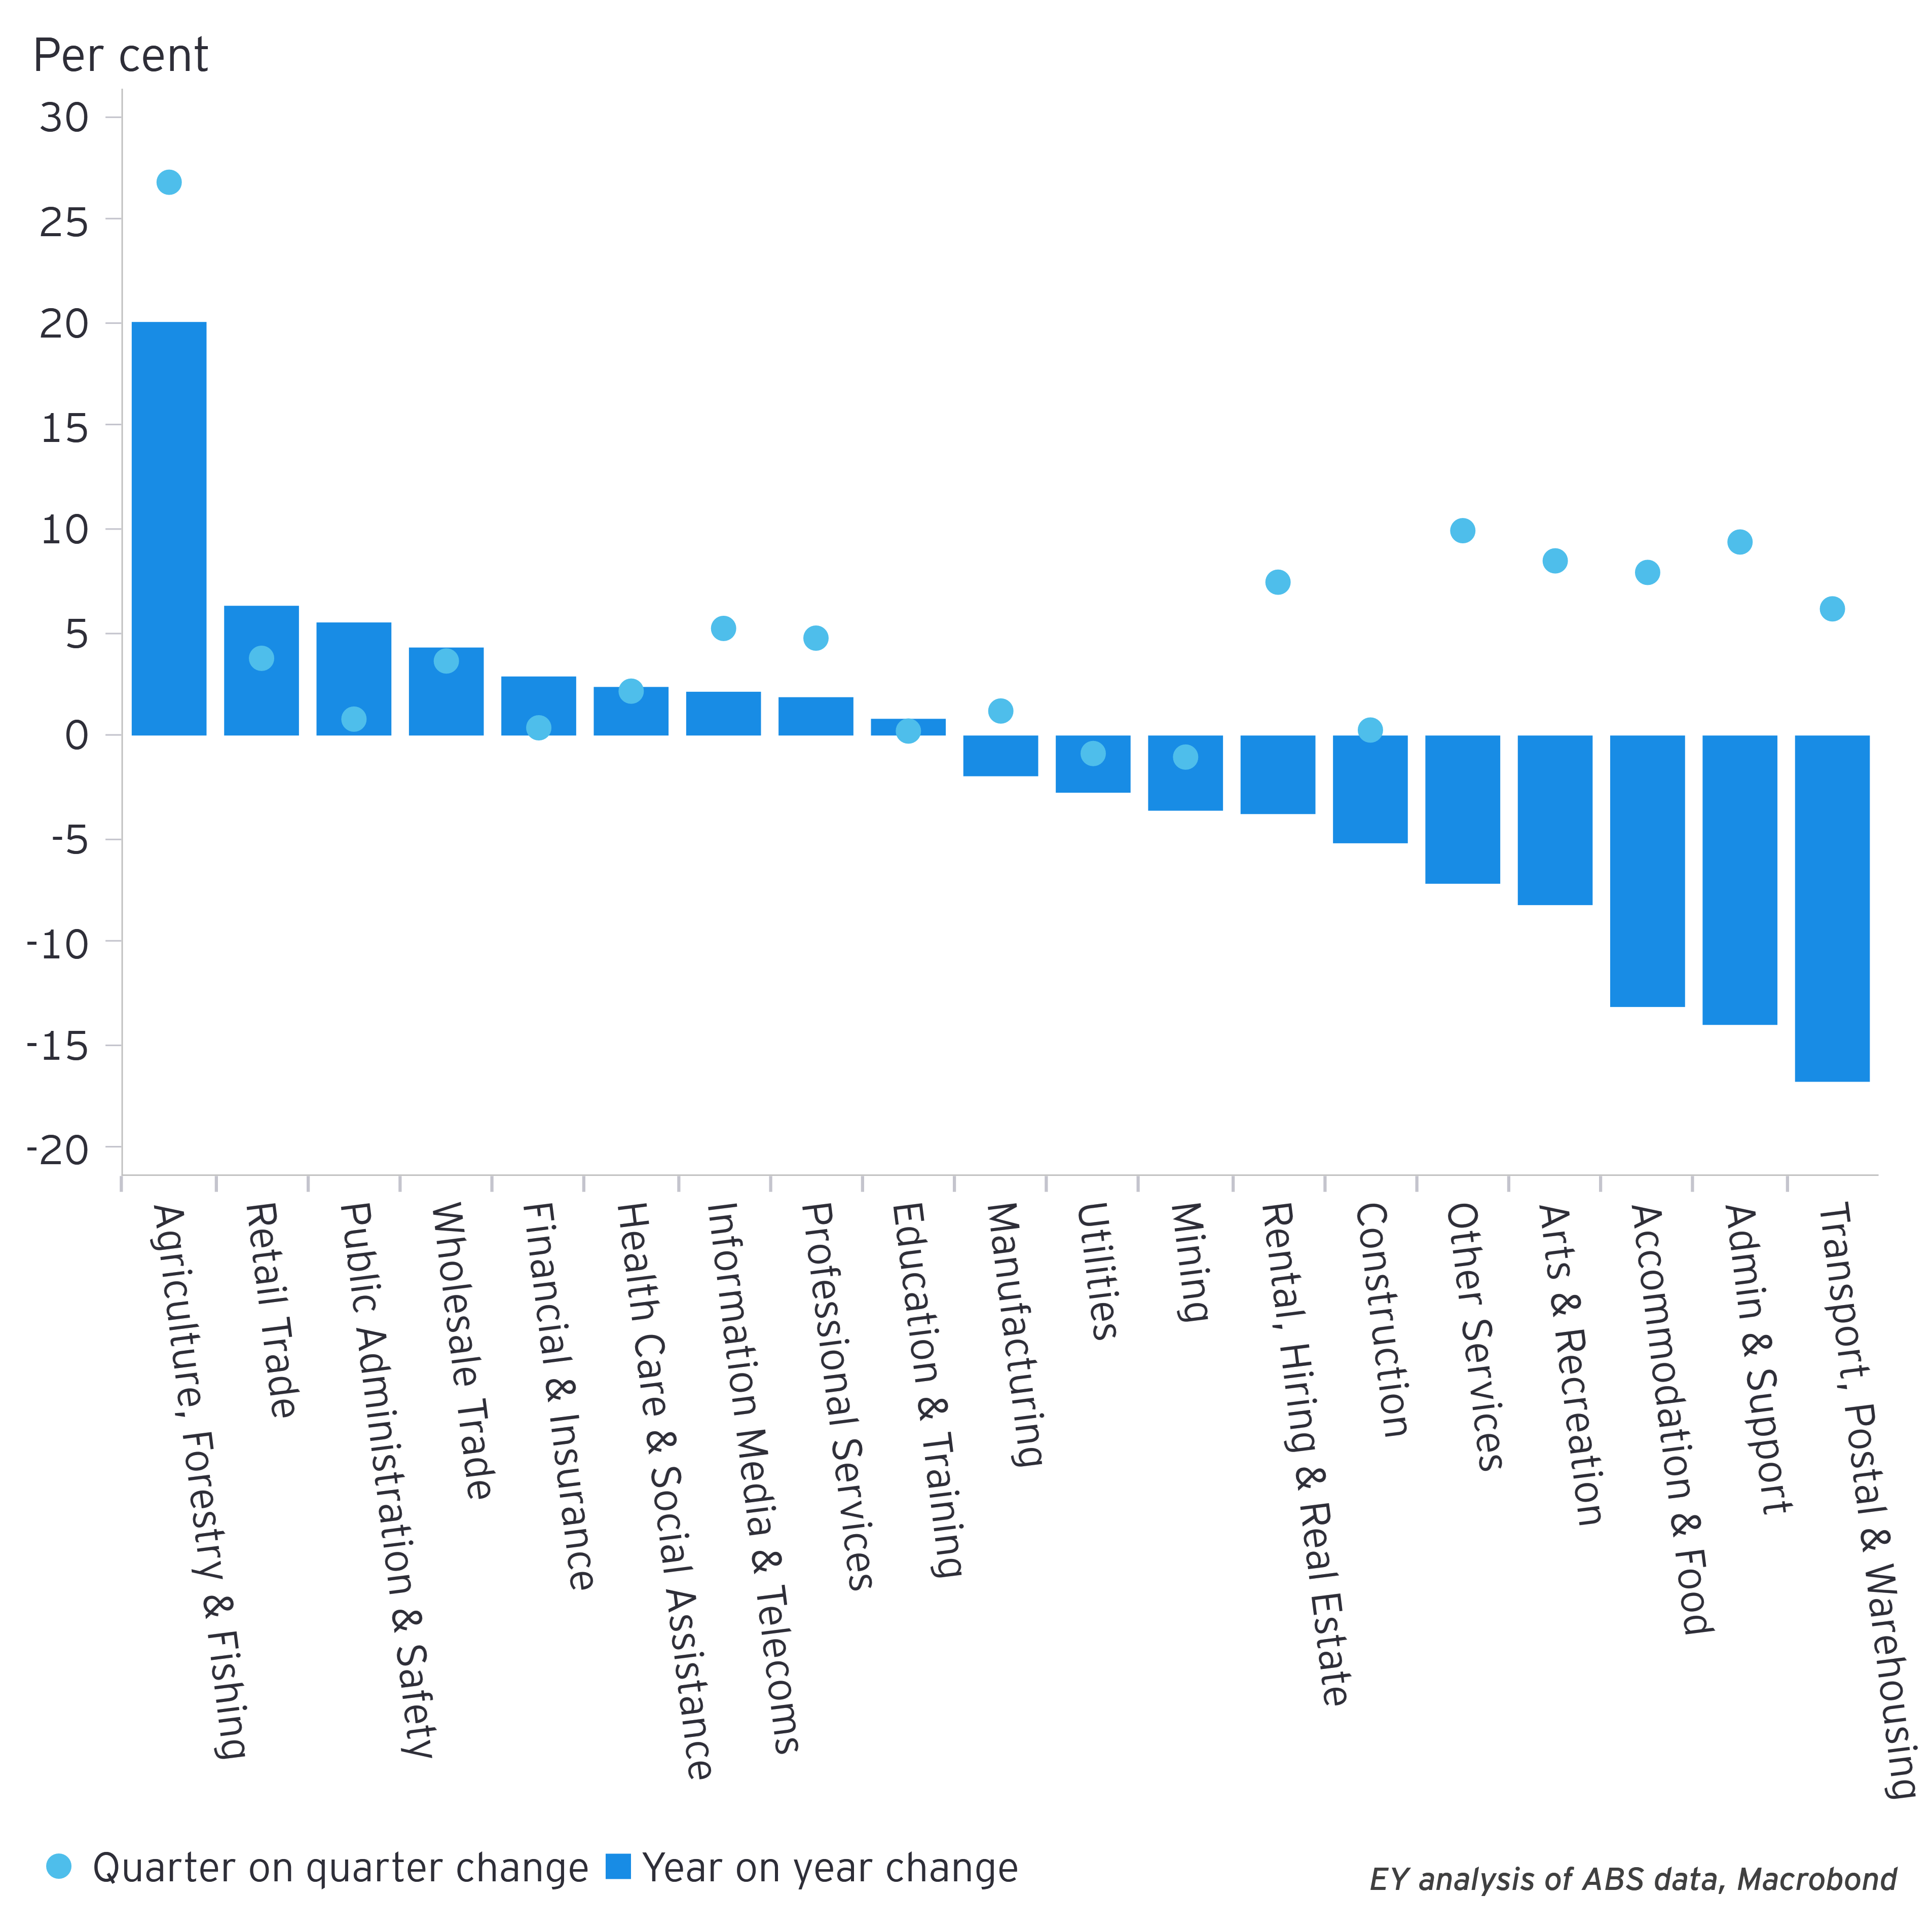
The economic recovery is becoming more even across industries, with service industries recovering alongside easing of restrictions, and experiencing the most substantial growth during the December quarter. Industries that stood out include administration services, arts & recreation, accommodation & food and other services - including personal care and automotive repair – which all expanded by more than 8 per cent in the quarter.
Improved weather conditions supported the agriculture sector, and a bumper grain harvest drove the industry’s 27 per cent increase during the quarter. Overall, 9 out of 19 industries are now larger than they were at the end of 2019, including wholesale and retail trade, finance & insurance and professional services.
Nevertheless, there remains a long way to go for a number of these industries which continue to be directly impacted by social distancing and border closures. For example, the transport, postal and warehousing industry for which air travel make up a large part, remains 16.7 per cent below pre-COVID levels.
The services sector has started to rebound

Economic Indicators
Other facts and figures from the December quarter
Low wage growth a key challenge for the economic recovery.
The Australian economy is well on the road to a ‘less uneven’ recovery. In his first speech of 2021, RBA (Reserve Bank of Australia) Governor Phillip Lowe cited three key reasons for our success to so far: success in containing the virus, significant fiscal support, and the ability of Australians to adapt and innovate. These strengths are likely to continue to support the recovery well into 2021, helped also by the local and global vaccine roll out and strong commodity prices.
The economy created 320,000 jobs in the December quarter, and a further 29,000 in January of this year, which means that more than 9 out of every 10 jobs lost in the early stages of the pandemic have now recovered. Importantly more than 80 per cent of fulltime jobs lost have recovered, although that is still less than part time jobs which have more than recovered pre-COVID numbers. Likewise, 89 per cent of jobs lost by females have recovered, compared to 98 per cent of males. Still uneven but becoming less so.
The unemployment rate averaged 6.8 per cent over the quarter, and in January was even lower at 6.4 per cent. Importantly the underemployment rate (one indicator of spare capacity in the labour market) is continuing to decline. At the end of December, it was 8.5 per cent, and is now lower than pre-pandemic levels. Overall, though, there is more spare capacity in the labour market than before COVID-19.
The jobs recovery is underway, but there is a long way to go before wages growth picks back up
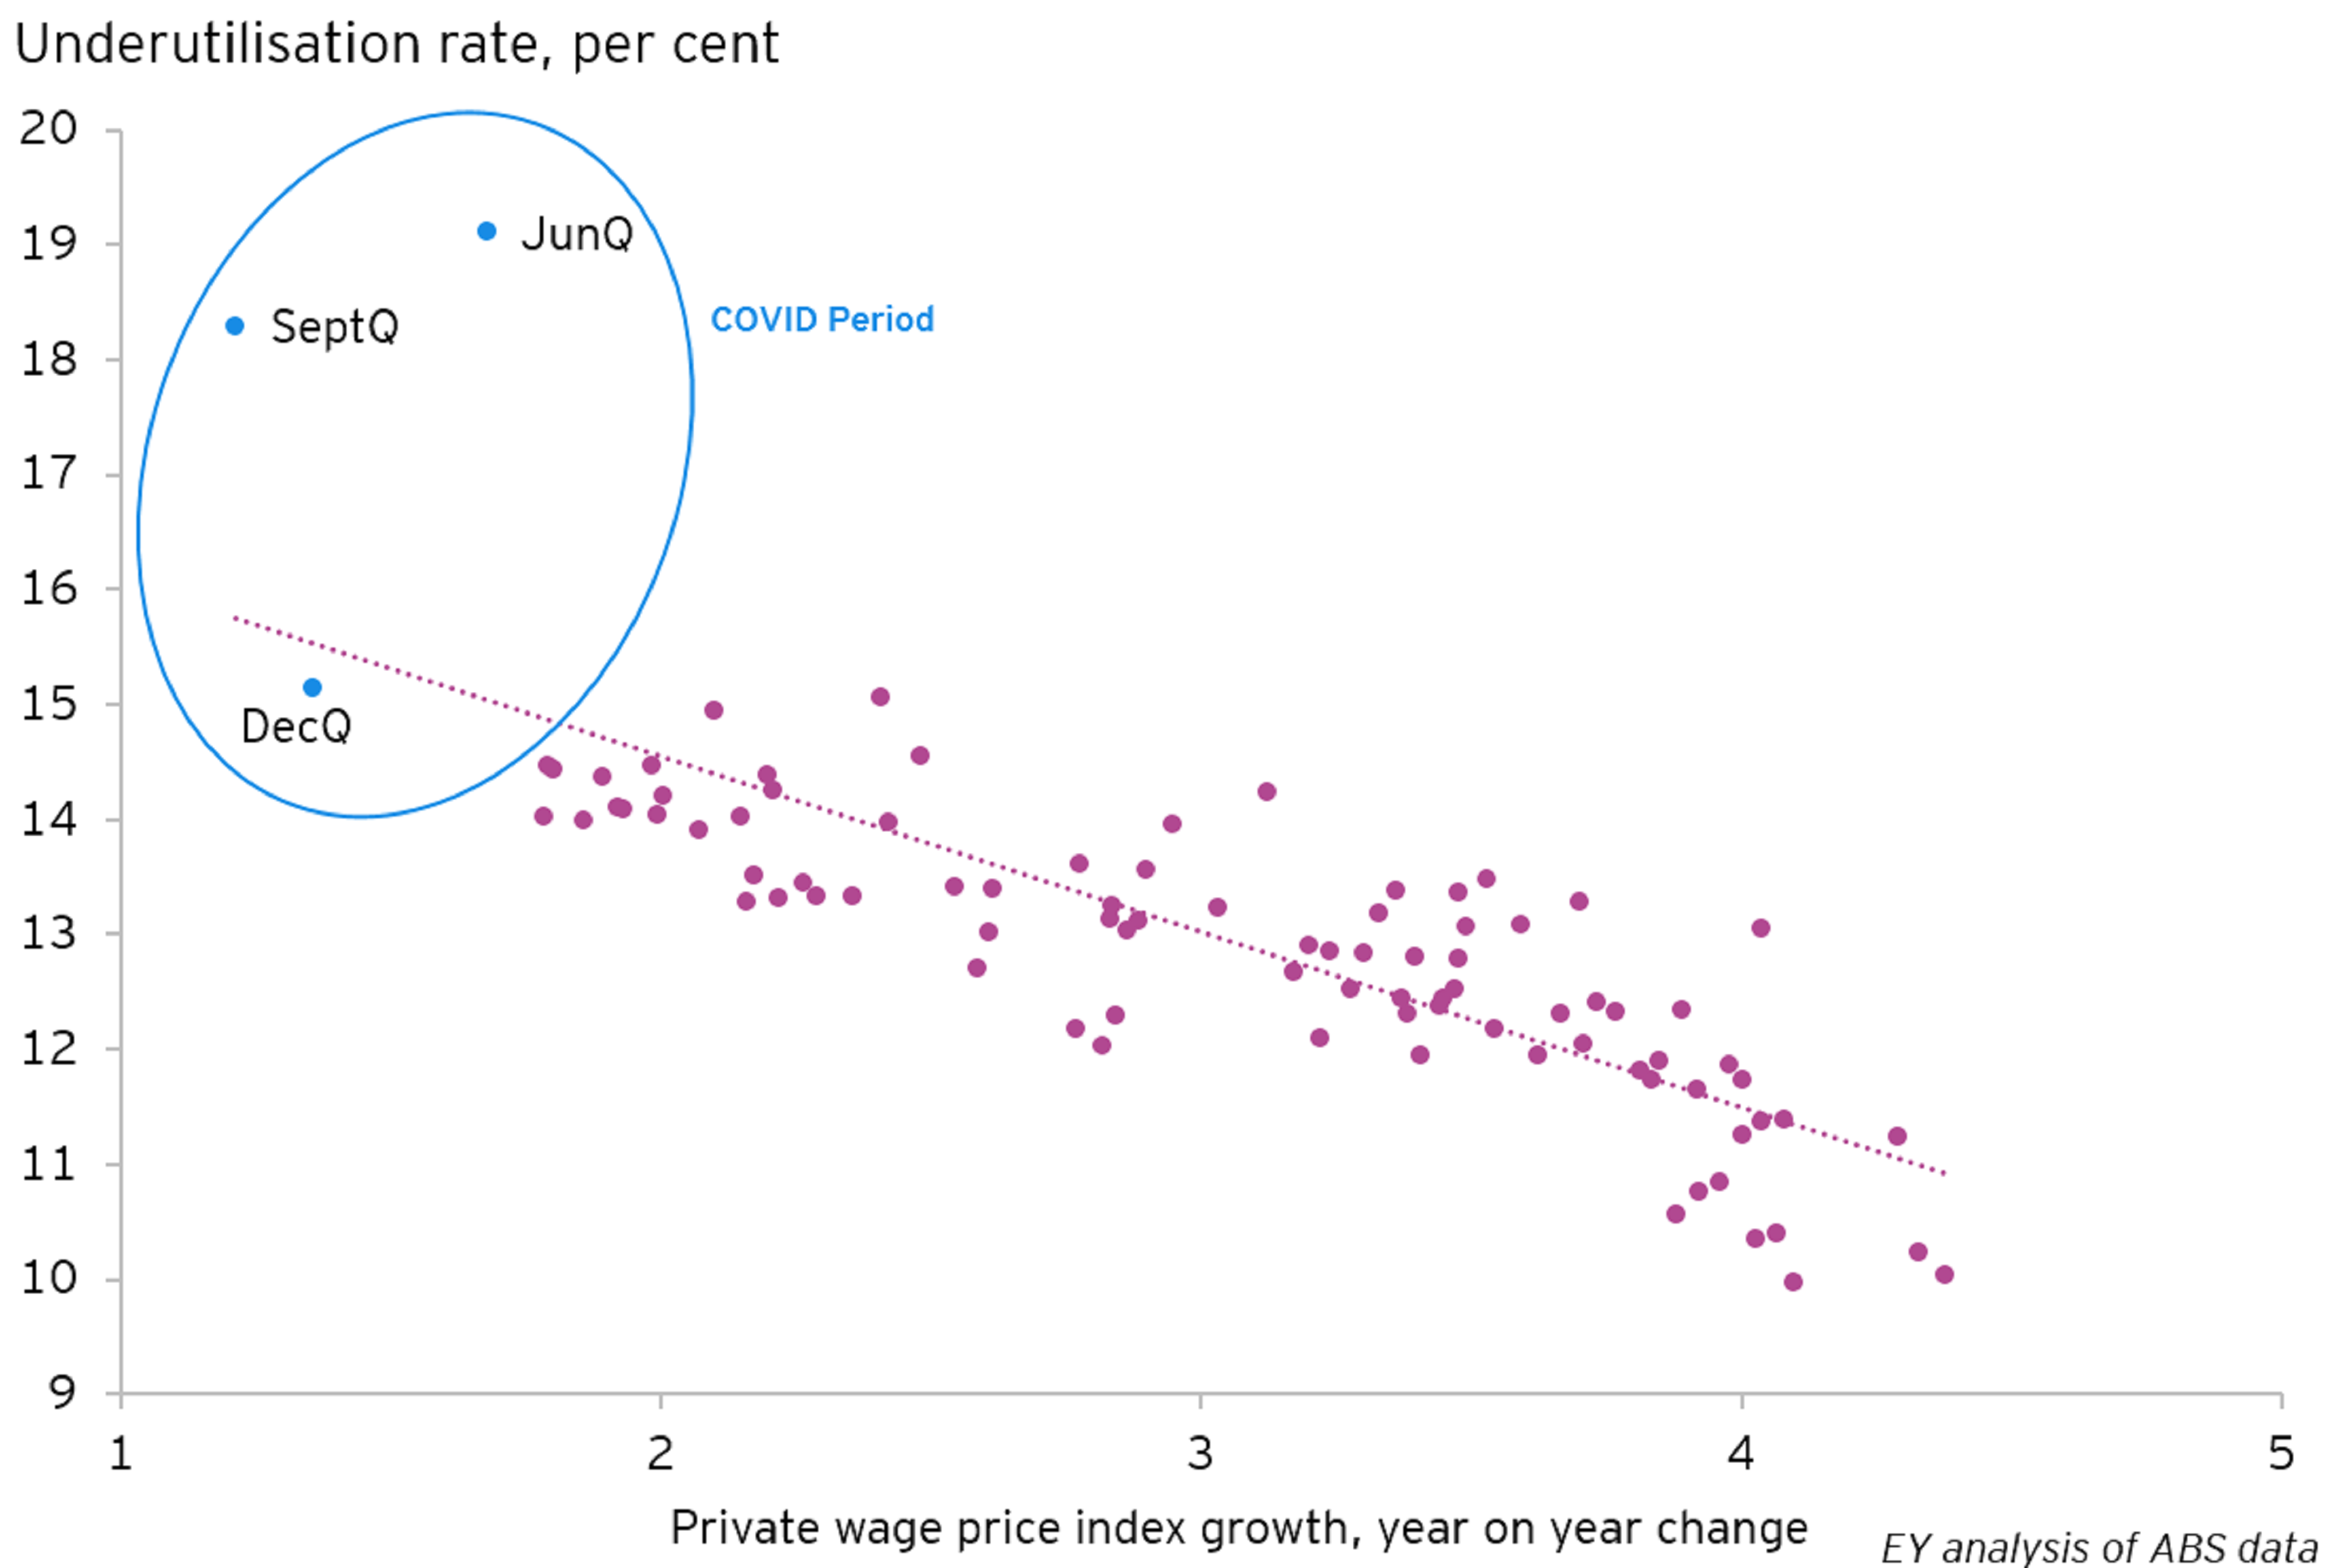
High spare capacity is likely to keep downward pressure on wages growth, which is currently running at a record low 1.4 per cent. Wage freezes, temporary wage cuts and delayed pay rises in response to the pandemic all contributed to soft wages growth over 2020. Low wages growth is expected to lead to subdued inflation over the next few years, even though the unwinding of Government measures (such as free Childcare) will likely see headline inflation jump temporarily higher.
The Australian dollar, which at an average of 0.73 over the December quarter remains on the upper end of the range of the past few years and has continued to appreciate in 2021. This is a challenge for exports, which account for around 20 per cent of economic activity in Australia. Keeping the currency weaker than it would be otherwise was a key factor behind the Reserve Bank of Australia’s recent announcement to extend the Quantitative Easing program.
Other Economic Indicators
| Economic Indicator | Q1 2020 | Q2 2020 | Q3 2020 | Q4 2020 |
| Labour Market | ||||
| Unemployment Rate (quarter average) | 5.2% | 7.0% | 7.1% | 6.8% |
| Underemployment (quarter average) | 8.7% | 12.8% | 11.3% | 9.4% |
| Participation Rate (quarter average) | 65.9% | 63.4% | 64.8% | 66.0% |
| Prices | ||||
| Headline Inflation (% change year on year) | 2.2% | -0.3% | 0.7% | 0.9% |
| Trimmed mean Inflation (% change year on year) | 1.7% | 1.3% | 1.2% | 1.2% |
| Wage Price Index (% change year on year) | 2.2% | 1.8% | 1.4% | 1.4% |
| Households | ||||
| Savings Rate (%) | 7.9% | 22.0% | 18.7% | 12.0% |
| National dwelling prices (% change year on year) | 7% | 8% | 5% | 3% |
| Financials | ||||
| Trade Weighted Index (quarter average) | 56.6 | 58.9 | 61.7 | 61.5 |
| AUD/USD (quarter average) | 0.66 | 0.66 | 0.72 | 0.73 |
| AUS 10yr bond yields (quarter end) | 0.77 | 0.87 | 0.84 | 0.97 |
| AUS 3yr bond yields (quarter end) | 0.25 | 0.26 | 0.17 | 0.10 |
Source: ABS and RBA
Summary
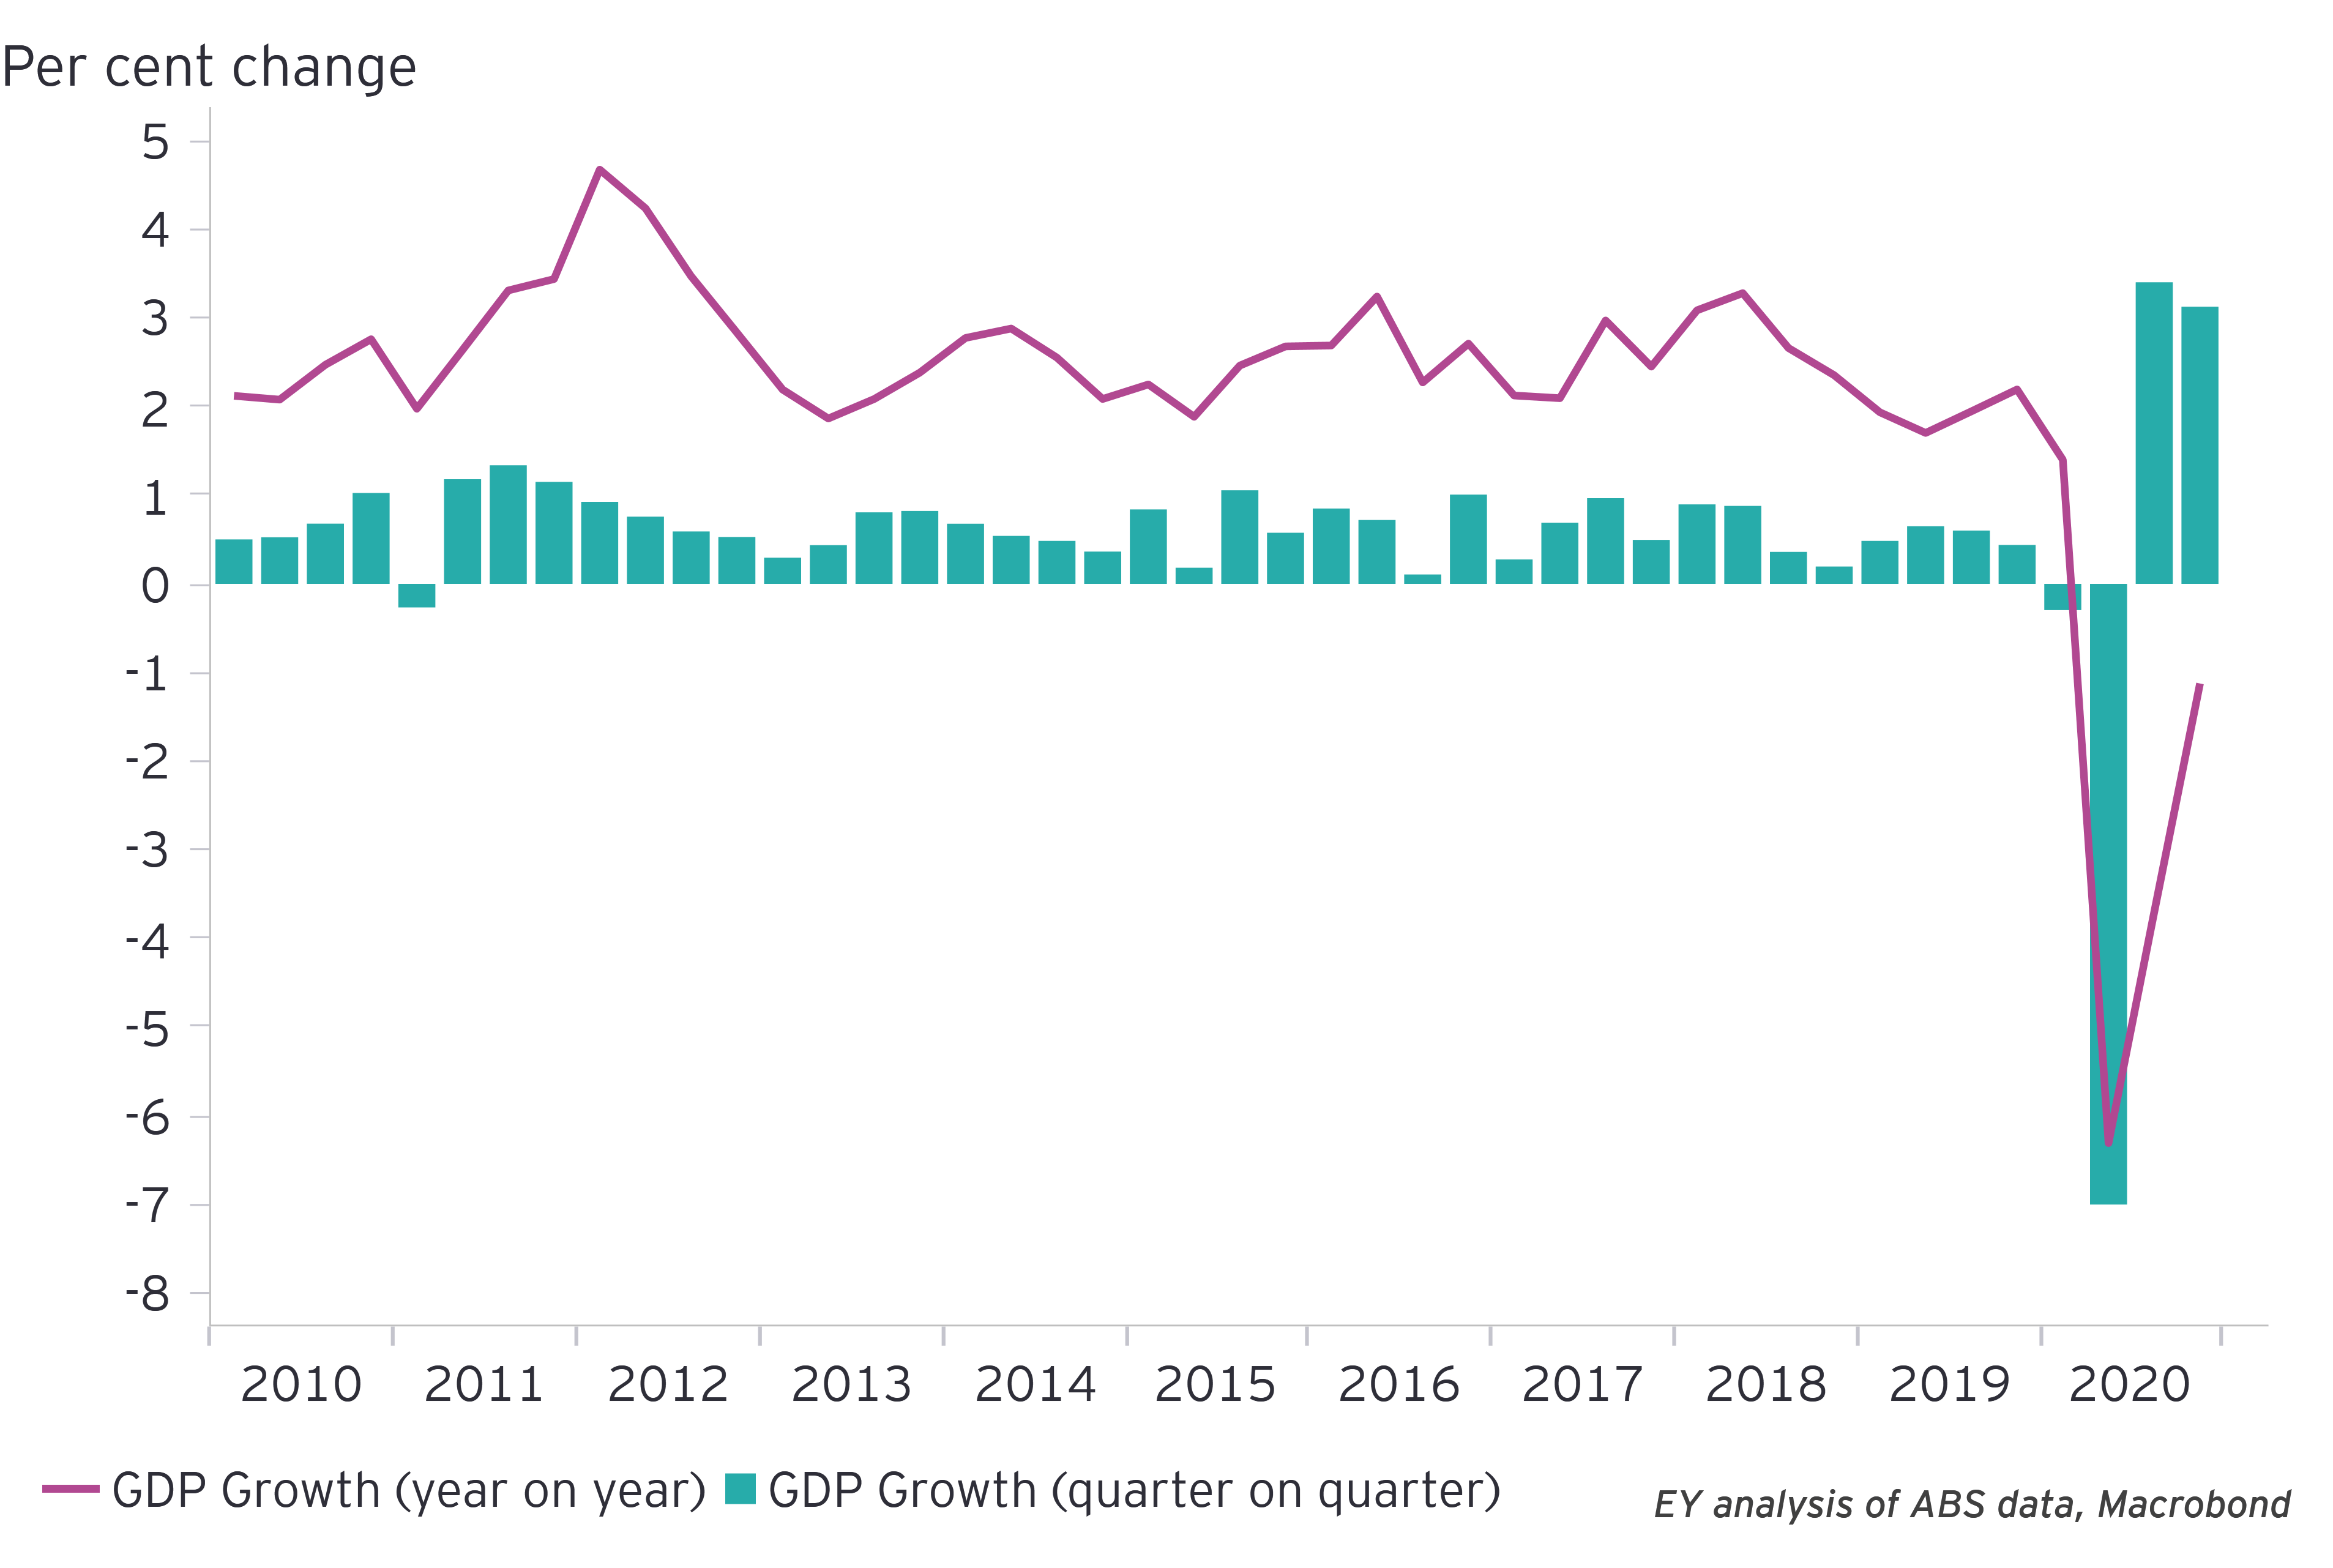
Australia has weathered the COVID-19 crisis significantly better than expected, and better than other advanced economies. The economy expanded by a stronger than expected 3.1 per cent in the December quarter, leaving a contraction of just 1.1 per cent through 2020.

