Availability of debt
Respondents indicated that they are favoring their existing borrower clients and allocating significant resources and capital to them. However, 90% of respondents expressed a willingness to lend to new borrowers at this time, albeit with a more conservative approach to their lending criteria. Lenders are demonstrating greater scrutiny than usual for new borrowers based on factors such as liquidity and financial strength, reputation, track record and historical performance.
Additionally, most respondents indicated that they are being more conservative in their asset and portfolio underwriting, including more stringent due diligence processes.
Notable changes to debt metrics including loan-to-value (LTV) ratios and credits spreads are having a material impact on the availability of debt for both new and existing borrower clients.
Mortgage relief
Nearly all participants have seen requests for mortgage relief, which they’ve handled on a case-by-case, borrower-by-borrower basis. Lenders are reviewing rent rolls, property operating statements and cash flow projections to determine which tenants are most likely to pay rent and which are most likely to default in the near or medium term. Mortgage relief is also dependent on the borrower’s business plan and the strength and history of the borrower-lender relationship.
Changes in debt metrics
Base rates, commercial mortgage spreads and mortgage rates
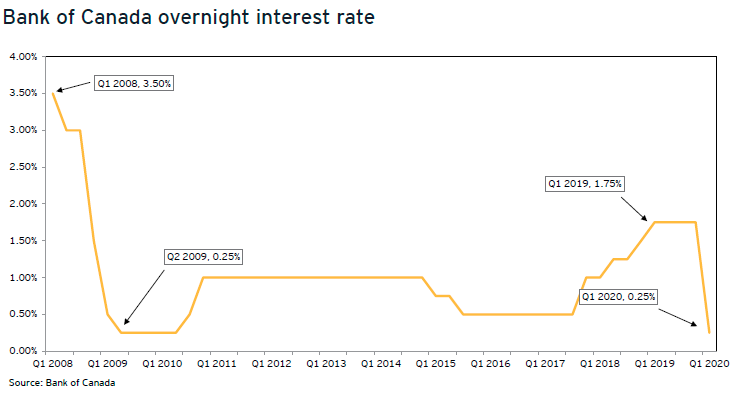
As a result of COVID-19, the Bank of Canada lowered its key overnight interest rate to 0.25% (from 1.75%), the lowest it has been since 2009 during the global financial crisis. This, in turn, has led to the prime rate dropping to 2.45% (from 3.95% pre-COVID). This results in a greater supply of credit which, all other things being equal, should lead to more competitive all-in commercial mortgage rates for borrowers.
However, our survey revealed that the sharp decrease in the overnight and prime rates, and subsequent decrease in the 10-year Government of Canada bond yield, was effectively entirely counterbalanced by an increase in commercial mortgage spreads ranging from 100 to 150 basis points (bps). As of Q4 2019, the 10-year Government of Canada bond yield was trading at 1.70%. At the time of the survey in Q2 2020, this same yield was posted at 0.50%, a decrease of 120 basis points.
According to survey respondents, this increase in commercial mortgage spreads is primarily to account for the elevated risk lenders are taking on during this period and the uncertainty related to future cash flows. Most respondents highlighted that commercial mortgage rate “floors” have been instituted for most 5- and 10-year deals for both new and existing borrower clients.
Based on the above, we note that high-quality assets and well-capitalized institutional and private borrowers with meaningful track records are able to access commercial mortgage rates at similar levels offered pre-COVID-19, while respondents suggested that the increase in commercial mortgage spreads for the next tier of assets and borrowers would more than offset the decrease in base rates. As such, asset and borrower bifurcation within various Canadian markets is occurring and is likely to become more pronounced over the next 12 months.

Loan-to-value ratios
Our survey revealed that 55% of respondents indicated that their LTV ratios have changed. Additionally, the 45% of lenders that indicated no change in their LTV ratios did suggest they are being more conservative from a property-level underwriting perspective, which necessarily translates to more conservative values and subsequently debt proceeds. Some of these underwriting changes may consist of an increase in bad debt allowance, changes in market leasing assumptions (e.g., market rental rates, rental rate growth and renewal probabilities), an increase in capitalization rates or changes to capital expenditure reserves. According to respondents, conservative underwriting is more likely to lead to lower property valuations and a higher required debt service coverage ratio, which results in less risk for the lender even if their LTV ratios remain largely unchanged.
More than half (55%) of respondents did indicate a decrease in LTV ratios ranging from 5 to 10 basis points. Respondents that provide short-term and/or bridge financing indicated the most significant decrease in LTV ratio.
Default projections
Respondents largely suggested that defaults are not likely to rise in the short term as both borrowers and tenants continue to benefit from government and mortgage relief programs.
Respondents were unanimous in their belief that borrowers on retail and hospitality assets will constitute the large majority of defaults. Respondents expect defaults to begin towards the end of 2020 as government assistance and cash reserves are eventually depleted. Defaults will also increase with more loan expiries, as borrowers will have difficulty refinancing given the more restrictive lending criteria.
Lenders, particularly ones that are focused on higher-risk assets, have begun to increase loan loss provisions in anticipation of potential defaults and impairments. Many lenders expressed concern that reduced market liquidity will result in borrowers being unable to divest of at-risk real estate holdings in a market with slower transaction velocity.
Outlook on mortgage spreads and all-in commercial mortgage rates
The majority of respondents (67%) expect credit spreads to increase over the next year. Credit spread fluctuations are dependent on a variety of factors, including the status of the benchmark base rate and/or a lender’s cost of funds, and will necessarily vary by asset class and geography, asset quality, creditworthiness of the rent roll in place, and the borrower’s financial strength.
Most respondents preferred to present a viewpoint on potential fluctuations in all-in commercial mortgage rates rather than credit spreads given the potential near-term volatility in base rates and differing cost of funds across institutions.
Overall, most respondents expect all-in rates to remain relatively consistent with pre-COVID-19 for high-quality assets with strong borrowers. Conversely, assets and/or borrowers outside of this first tier should largely expect an increase in all-in financing rates relative to pre-COVID-19 levels as lenders implement wider spreads and floors to mitigate both some of the property-level cashflow risk and structural economic risk and its corresponding impact on commercial real estate. In addition, non-bank lenders have indicated that their all-in financing rates are likely to be higher one year from today.
EY outlook and perspectives
As shown by the survey results, lending institutions are pricing in increased risk on debt capital, applying higher scrutiny on borrower clients and largely asking for higher equity contributions on deals.
As unemployment figures remain near historic levels and consumer spending is forecasted to remain below normal levels for many months, an expeditious recovery appears less likely. As such, we anticipate that higher yield expectations are likely to set in across most major asset classes and geographies, with Tier 1 trophy assets being the least impacted. Our outlook is supported by the following analyses and historical trends.
Government of Canada bond yields vs. cap rates
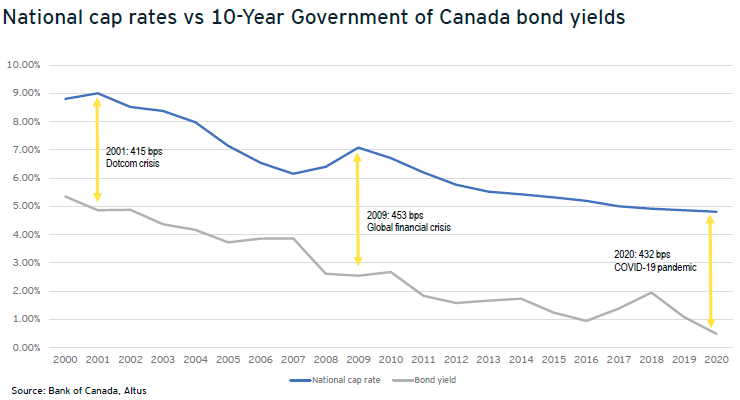
One of the key relationships that we typically evaluate is the spread between cap rates and the 10-year Government of Canada bond yield. Generally, bond yields and cap rates move in the same direction – as one decreases or increases, so does the other.
However, we see a divergence from this trend during times of economic distress, as evidenced by the last two major events. In both the 2000-01 dotcom crash and the 2008-09 global financial crisis, bond yields decreased and cap rates increased, which translated to the widest spreads between the two data points.

The COVID-19 crisis has led to a sharp drop-off in bond yields, while we have little transaction data to date to earmark cap rate movement. From a historical perspective, we should anticipate an upward movement in cap rates as commercial real estate investors’ return expectations will increase to account for elevated property-level and market risk. Between Q2 2007 and Q2 2020, the minimum, maximum and average spread between the 10-year Government of Canada bond yield and the average national cap rate were 1.48%, 4.53% and 3.34%, respectively.
Band of investment theory
Another perspective of viewing the anticipated movement in cap rates is through the band of investment theory, which is based on the premise that most commercial real estate properties are purchased with a combination of debt and equity capital, and the cap rate must satisfy the required return on both investment parameters. The cap rate therefore consists of a debt component and an equity component, and both work together to impact the levered returns of a commercial real estate investment.
This means that if the cost of debt increases and/or the ratio of debt to equity (i.e., loan to value) decreases, investors will need to contribute higher levels of equity, which generally command higher returns. This theory demonstrates that cap rates are directly influenced by the availability and cost of debt, and through analysis of the lending market we can deduce valuable insights applicable to our current market.
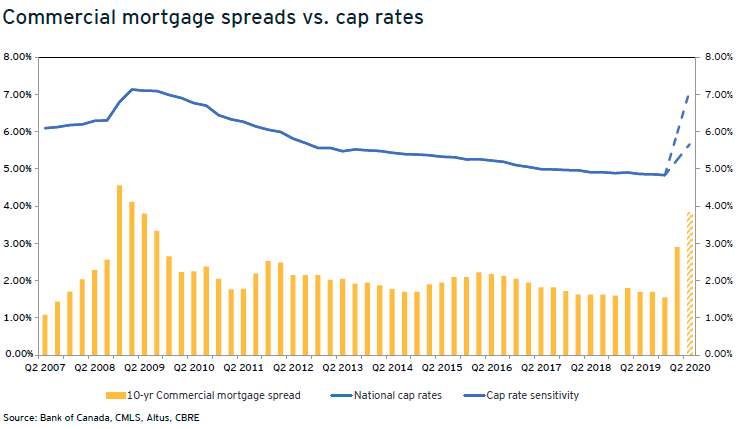
The following chart shows the average quarterly surveyed cap rates for the four major asset classes - office, industrial, retail and multi-family - along with 10-year commercial lending spreads.

We note that spreads increased by 225 basis points in late 2008, and as of Q1 2020 lending spreads had increased between 100 and 150 basis points. Based on this historical data point, an additional 100 basis point increase in spreads could potentially be anticipated later this year. If we follow the cap rate trendline of 2008, which shows the national average rate increased by 83 basis points, and assuming bond yields do not decrease further, we could see average cap rates jump from 4.84% as at year-end 2019 to 5.67% in Q2/Q3 2020.
There is a possibility, however, that average cap rates will increase at a rate that is more in-line with the change in commercial lending spreads. In 2008, commercial spreads increased by 227 basis points, reaching a high of 4.57%. If we see LTV ratios drop further and the overall availability of debt become more challenging to obtain, average cap rates could jump even higher than in 2008 and surpass 6.0% across all asset types.
The DNA of a cap rate
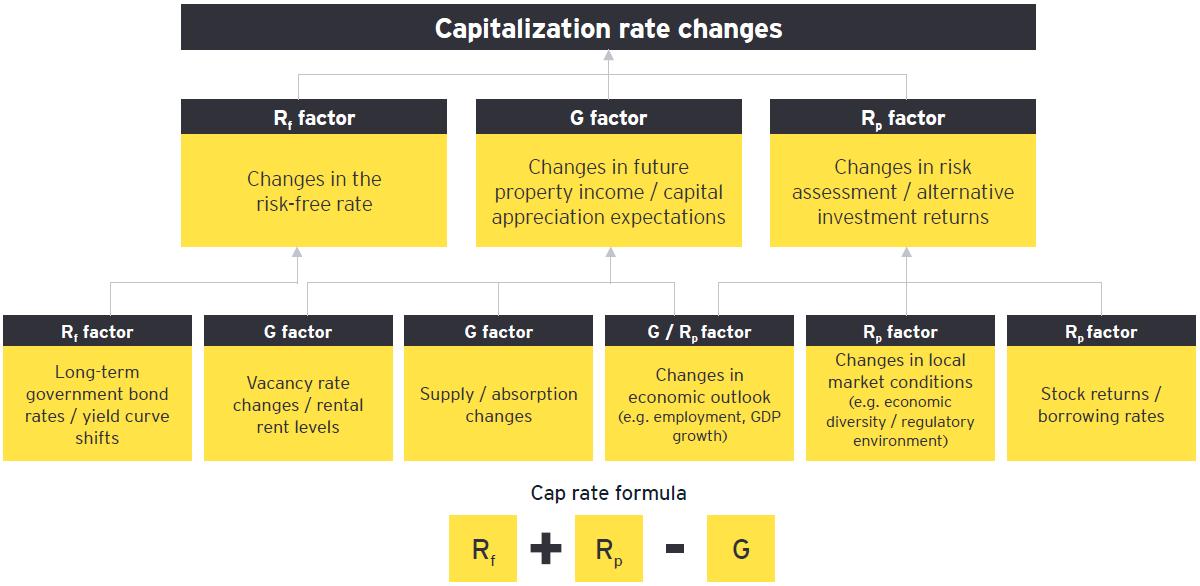
A capitalization rate is composed of three main components: the risk-free rate (Rf), a risk premium (or spread over risk-free rate) (Rp) and growth rate (G) assumptions. To understand anticipated movements in a cap rate, we need to examine what is happening to each underlying component of the rate.

Risk-free rate: As previously acknowledged, the risk-free rate has decreased substantially over the past quarter. The drop in the risk-free rate of approximately 100 basis points would initially lead one to believe that further decreases in cap rates could be expected. Instead, the drop in the risk-free rate is being counterbalanced by two other forces - the risk premium and growth assumptions.
Risk premium: The risk premium has a direct correlation to borrowing rates and local market conditions. As previously mentioned, the widening of credit spreads and the overall increase in the cost of borrowing for most assets has led to an increase in the risk premium that more or less offsets the drop in the risk-free rate. The change in the perception of risk and the pricing of risk in the debt markets would lead one to believe that this factor will result in an increase in cap rates.
Growth rate: Cap rates are reduced when market indicators point to periods of significant growth. The growth factor is a combination of economic outlook, changes in supply and absorption, vacancy rates, and rent rate change assumptions. The most recent economic forecasts indicate the foreseeable future will likely be a period of slow to moderate growth. There is limited expectation of rental growth rate and most are anticipating increases in vacancy rates across all asset classes. As such, expectations of growth in the real estate market are reduced from where they were in Q4 2019, which will put further upward pressure on cap rates.
An illustrative example is shown below on how changes in the three factors would impact cap rates:

Summary
Over the course of April and May, EY Canada’s Transaction Real Estate team surveyed and tracked the Canadian real estate debt market to gauge changes in lending criteria, availability of new debt, and changes in both commercial mortgage spreads and all-in commercial mortgage rates. The ultimate goal was to provide an informed viewpoint on capitalization rate impacts.
Our survey includes representatives from more than 25 lenders, including chartered banks, institutional lenders, alternative lenders and mortgage brokers.
Contact us
Like what you’ve seen? Get in touch to learn more.


