
Sector abbreviations:
CC&M – Chemicals, construction and materials
E&U – Energy and utilities
IG&S – Industrial goods and services
MT&T – Media, technology and telecommunication
R&CP – Retail and consumer products
-
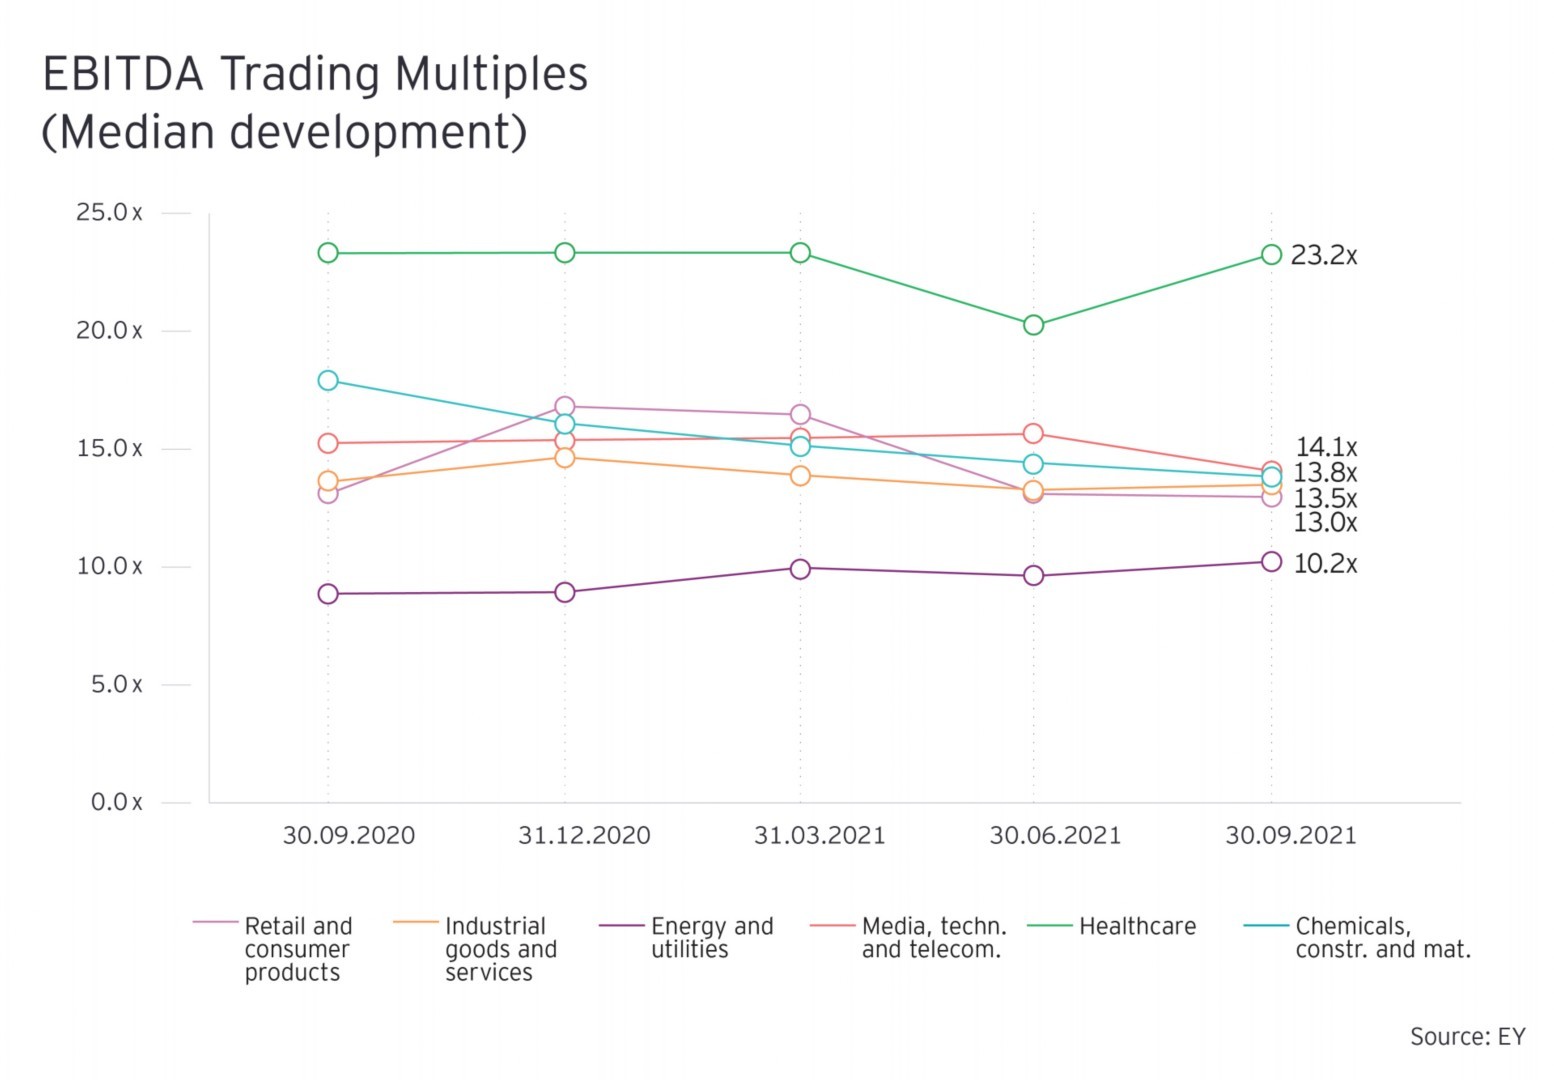
1. Trading Multiples Switzerland
In Q3 2021 the median trading EBITDA multiples of the sectors Chemicals, construction & materials (CC&M) and Retail & consumer products (R&CP) continued their declining trend as compared to Q2 2021 of the current publication and reached 13.8x and 13.0x respectively. On the other hand, the median trading EBITDA multiples of the remaining four sectors developed in the opposite direction as compared to Q2 2021 of the current publication. Those multiples increased for the Healthcare sector from 20.3x to 23.2x, for Energy and utilities (E&U) sector from 9.6x to 10.2x and for Industrial goods and services (IG&S) sector from 13.3x to 13.5x. For the Media, technology and telecommunication (MT&T) sector, however, the median multiple decreased from 15.6x to 14.1x.
Given that for Q2 and Q3 2021 the EBITDA figures for the companies across all the sectors are based on the financials as of June 2021, the upwards or downwards development of the multiples is mainly driven by the development of market capitalization of the majority of the underlying companies.
Further, it should be noted that in the current publication we increased the outlier removal boundaries for the median calculation to 50x (before: 25x) in all quarters. For this reason, the median multiples of the current publication cannot be directly compared to our publication in the previous quarter. Due to the adjustment of the outlier removal boundaries the median multiples are higher as compared to the median multiples presented in our previous publication.
-
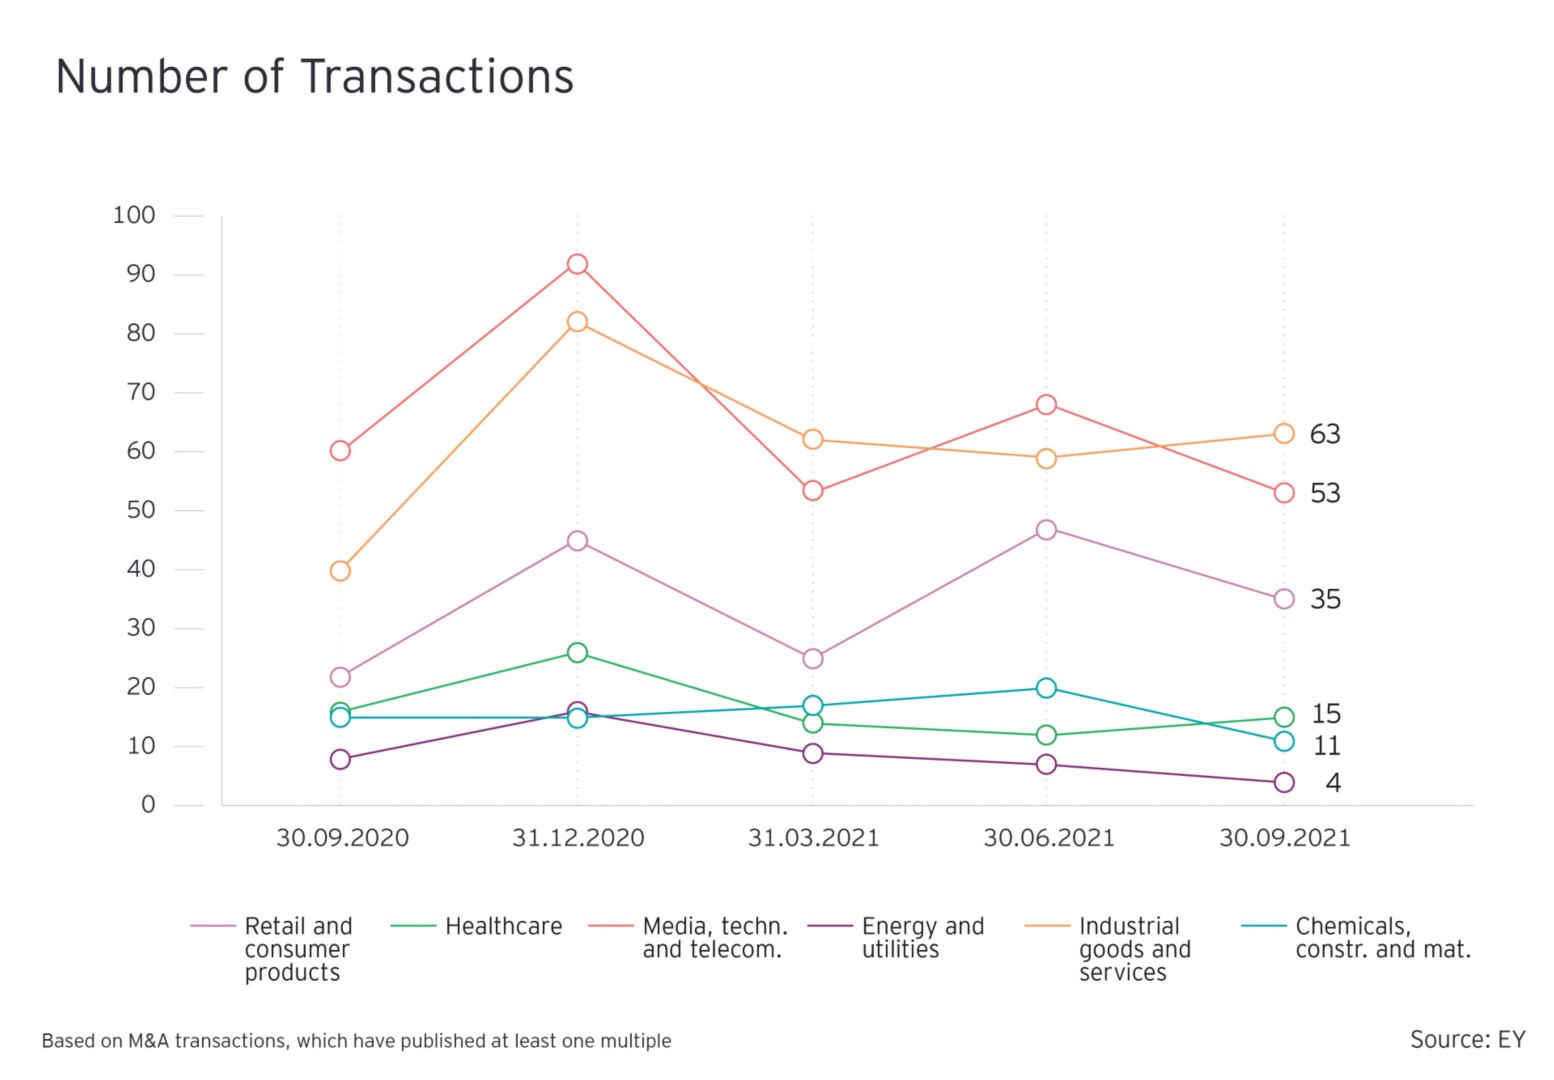
2. Transactions Europe
As opposed to Q2 2021 of the current publication, the number of deals in the European M&A activity declined in Q3 2021 by 15%. The total number of transactions (M&A deals, which were announced or announced & closed and have published at least one of the Revenue, EBITDA or EBIT multiples) across the six sectors shrunk from 213 to 181 during Q3 2021.
At the same time, in Q3 2021, the market observed 12% more transactions than in same quarter last year.
The overall decline in the number of transactions was primarily driven by the following four sectors: CC&M (45%), E&U (43%), R&CP (26%) as well as MT&T (22%).
In terms of sector specific performance, CC&M sector had a 45% decline to 11 deals after having witnessed a moderate growth in the last two quarters, while reaching 22 deals in Q2 2021.
E&U sector continued its declining trend from the last two quarters and saw the number of transactions decrease from 7 to 4 in Q3 2021.
R&CP sector, which had experienced an 88% growth in the number of transactions in the previous quarter, observed a slowdown from 47 to 35 transactions in Q3 2021.
MT&T sector also saw a decline of 22% to 53 transactions, which is also the lowest number on a quarterly basis since Q3 2020.
On the other hand, the number of transactions in the Healthcare sector increased by 25% to 15 transactions and in the IG&S sector by 7% to 63 transactions, after having experienced a decrease over the last two quarters.
The average deal volume (total deals value/number of deals) increased significantly by 135% during Q3 2021, which was primarily attributable to a substantial increase in deal sizes in four out of six sectors including CC&M, Healthcare, MT&T and R&CP.
Since the last 3 quarters, UK has retained the top spot among countries in terms of number of deals and location of the target company. In Q3 2021 the number of deals in UK contributed 25 % of total transactions, followed by Germany (12%) and France (10%).
-
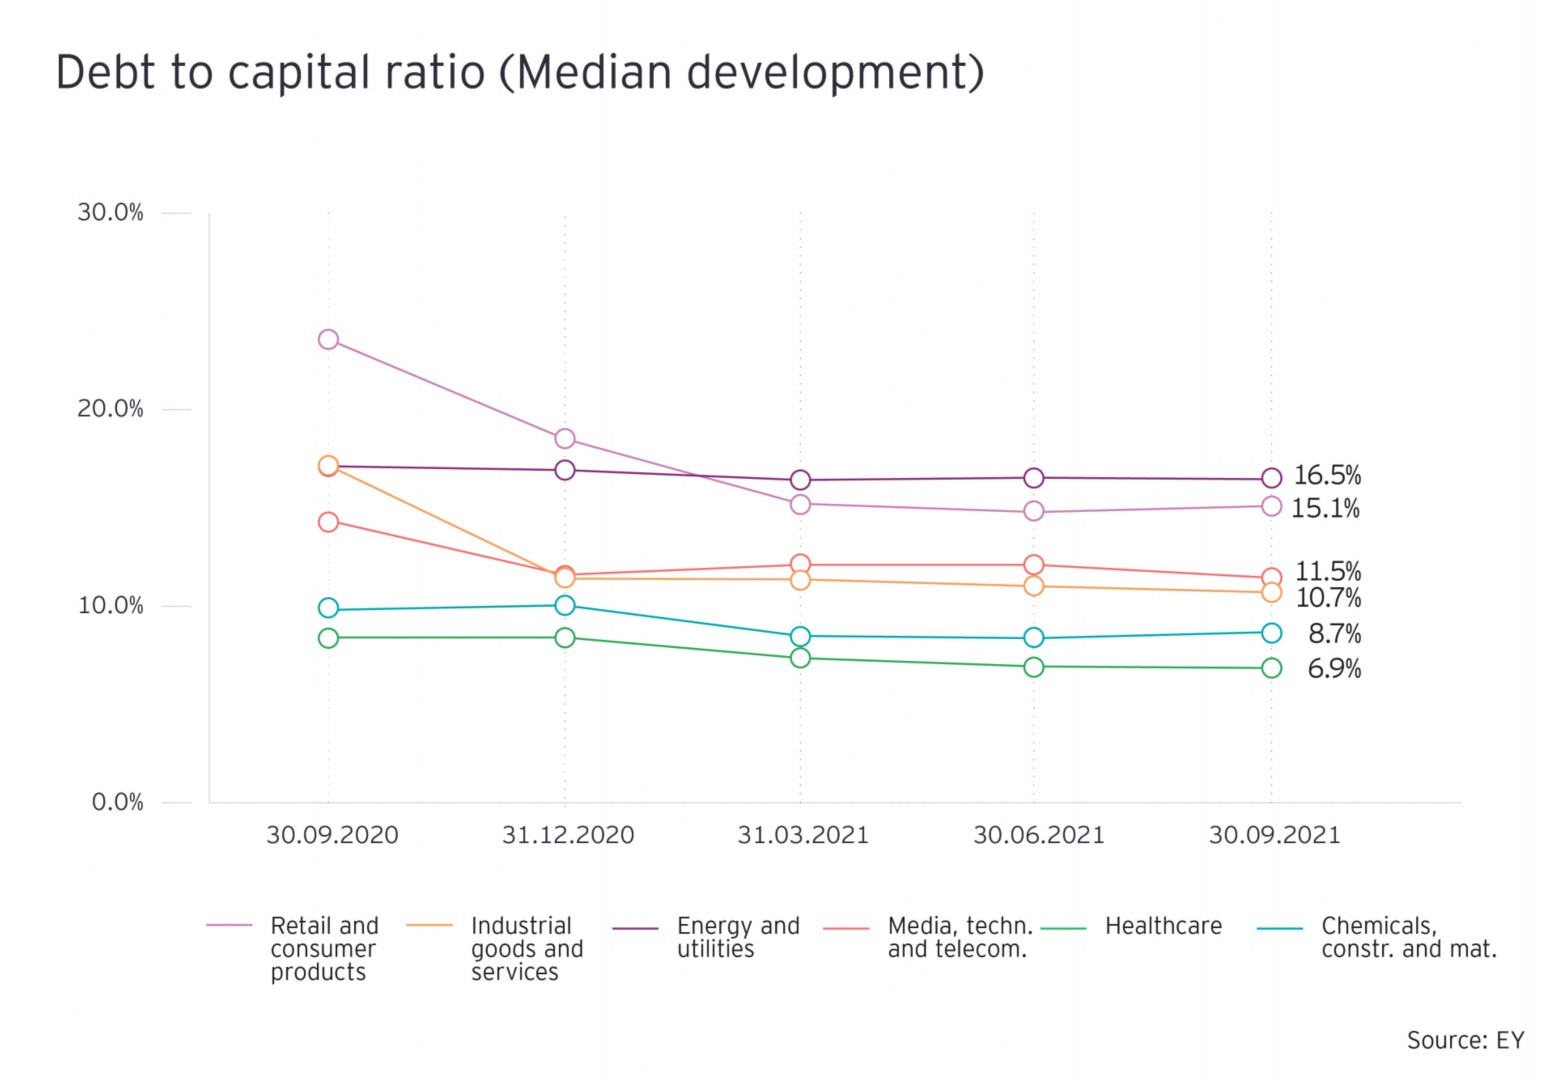
4. Debt to total capital ratio
Given that for Q2 and Q3 2021 the debt figures for all companies are based on financials as of June 2021, the change in the debt to total capital ratio is primarily driven by the development of market capitalization of the companies.
The median debt to total capital ratio for IG&S sector continued the declining trend since Q3 2020, reaching 10.7% in Q3 2021. In the latest quarter, the driving force was mainly the expansion of market capitalization for 60% of the companies.
For the MT&T sector the median ratio also declined in Q3 2021, reaching 11.5%. However, this was caused by the stronger impact from the increase in market capitalization for a minor group of the companies (24%) rather than by the decrease in market capitalization for the larger group of the companies (76%).
For CC&M sector the median debt to capital ratio increased slightly from 8.4% to 8.7% and for R&CP sector it increased from 14.8% to 15.1%, driven by a decline in market capitalization for most of the companies in these sectors.
For the Healthcare and the E&U sector, the median debt to capital ratio remained almost unchanged at 6.9% and 16.5% in Q3 2021. For the Healthcare sector almost the same portion of companies experienced a decline in share price as the one with an increase in share prices, leading to an unchanged ratio. For the E&U sector, however, the stronger decrease in share prices of the minor group of the companies (25%) offset the impact of increasing share price of the larger group of the companies (75%), leading to un unchanged ratio.
When comparing the debt to total capital ratios to the figures of the same quarter in 2020, the ratios decreased across all the sectors.
-
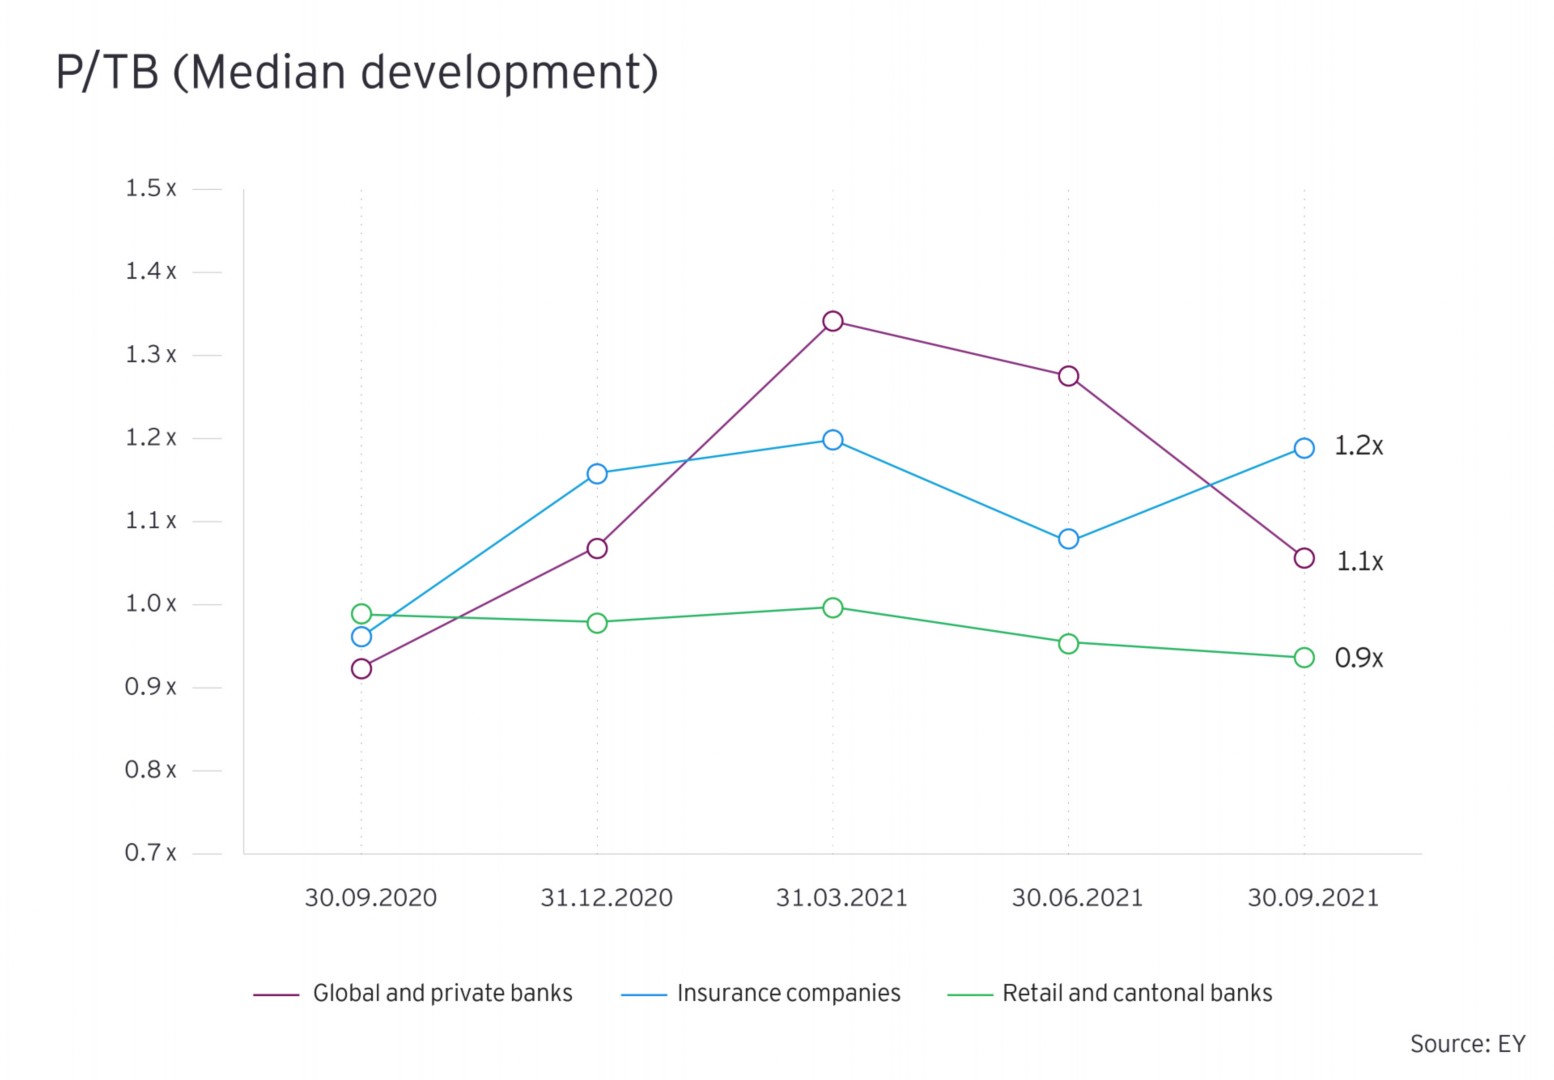
6. Banking and Insurance Sector
In comparison to Q2 2021, where we had observed a decline in the median P/TB multiple for all three sectors, in Q3 2021, only two sectors, namely Global and private banks and Retail and cantonal banks continued their declining trend. However, in the case of the Insurance companies the P/TB multiples witnessed an increase.
For Global and private banks, the median P/TB multiple declined from 1.3x to 1.1x primarily due to an increase in tangible book values of 67% of the banks. On the other hand, the reason for the decline in the median P/TB multiple of Retail and cantonal banks from 1.0x to 0.9x in Q3 2021 is primarily attributable to a decline in market capitalization of the majority (63%) of the Retail and cantonal banks.
Further, the median P/TB multiple of insurance companies increased from 1.1x to 1.2x in Q3 2021 as compared to the previous quarter on account of the decline in tangible book value of the majority (83%) of the companies in the insurance sector.


Summary
Our Valuation, Modeling & Economics Team is here to support you with Valuations, Liquidity & Scenario Planning, Portfolio Analysis, as well as other services to help you navigating through your action plans!
Acknowledgements
We thank Elizaveta Leontyeva and Besa Alusi for their valuable contributions to this article.
