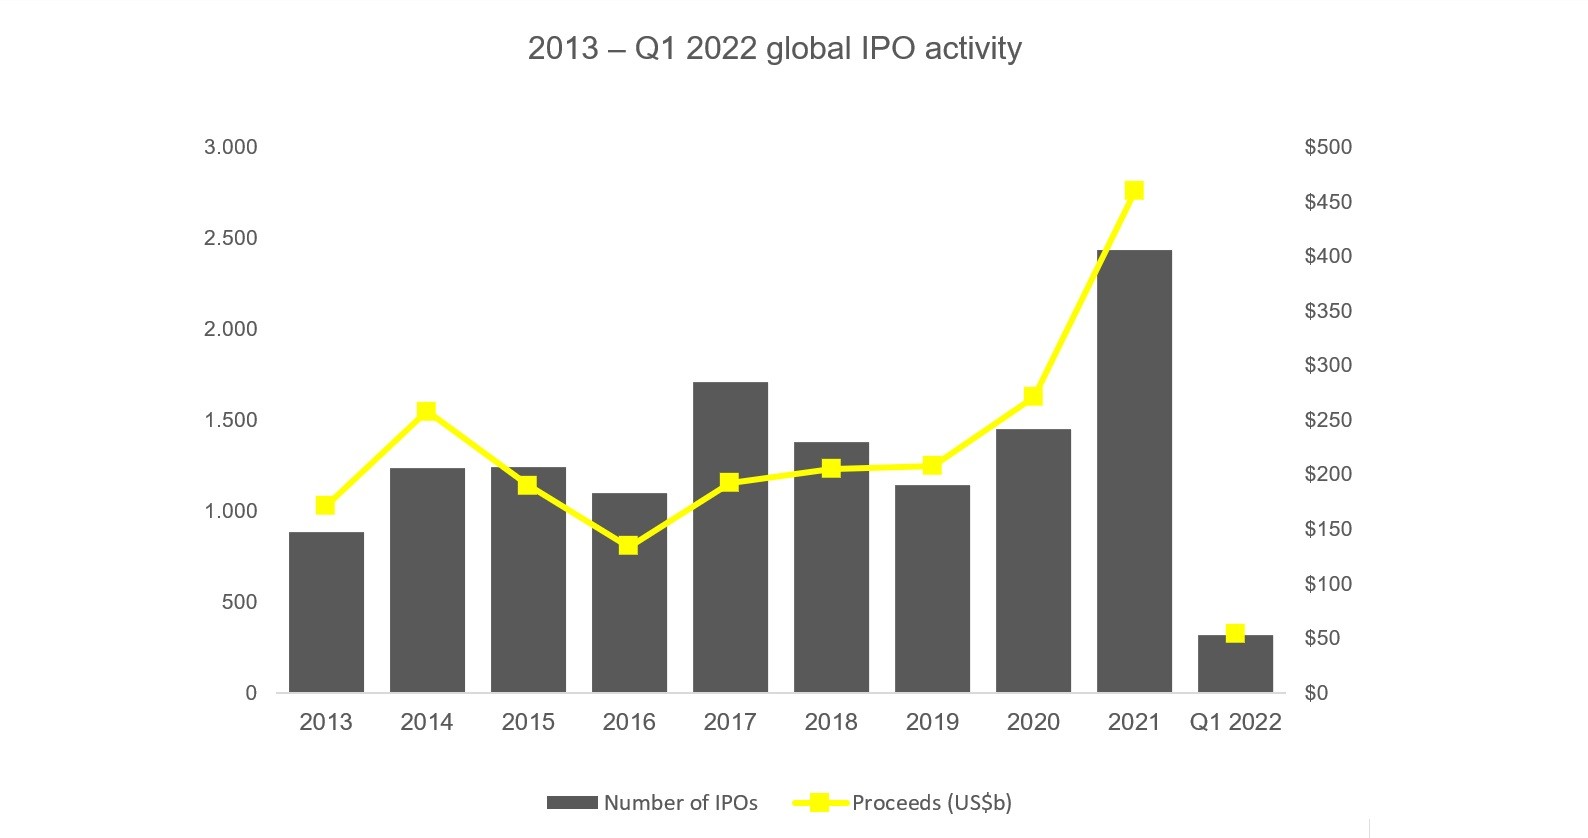
- Q1 2022 global IPO volumes fell 37%, with proceeds down by 51% year-on-year (YOY)
- This was despite the strongest January in 21 years by proceeds
After record-high levels of global IPO activity in 2021, volatile market conditions have resulted in a significant slowdown during the first quarter of 2022. The year started off strongly, continuing the momentum of Q4 2021, with January producing the strongest opening month in 21 years by proceeds. However, by the second half of the quarter, worldwide stock market declines shifted the trajectory dramatically in the opposite direction, resulting in a significant drop in overall activity. For Q1 2022, the global IPO market saw 321 deals raising US$54.4b in proceeds, a decrease of 37% and 51% YOY, respectively.
The sudden reversal can be attributed to a range of issues, both emerging and residual. These include the rise in geopolitical tensions; stock market volatility; price correction in over-valued stocks from recent IPOs; growing concerns about a rise in the commodity and energy prices; impact of inflation and potential interest rate hikes; as well as the COVID-19 pandemic risk continuing to hold back a full global economic recovery.
In line with the sharp decline in global IPO activity there was a considerable fall in cross-border, unicorn, mega (proceeds above US$1b) and SPAC IPOs. There were also a number of IPO launches postponed due to market uncertainty and instability. These and other findings were published by the EY organization.
Americas IPO markets pale in comparison to Q1 2021
IPO activity in the Americas region weakened this quarter in comparison to the record- breaking Q1 2021, with deals down 72% (37 IPOs) and proceeds falling by 95% (US$2.4b). Health and life sciences led the number of deals while a single large deal drove financials to lead by proceeds. In the Americas, the materials sector followed by number of deals, driven solely by the smaller Canadian exchanges (CSE and TSX-V), while health and life sciences ranked second by proceeds.
Asia-Pacific IPO proceeds rose 18% in Q1 2022 benefiting from mega IPOs
The Asia-Pacific region started the year strongly with an 18% rise in proceeds YOY, despite a 16% decline by deal numbers in Q1 2022. Four of the seven mega IPOs in Q1 2022 globally were listed in this region, including two of Q1’s largest IPOs by proceeds. The region saw 188 IPOs raising US$42.7b in proceeds, surpassing Q1 2021 which had raised the highest Q1 proceeds in 21 years. In terms of sector activity, industrials led by volume (40 IPOs, US$3.3b), followed by materials (37 IPOs, US$5.3b), while energy and telecommunications led by proceeds (US$11.2b via 8 IPOs and US$8.5b via 3 IPOs, respectively).
EMEIA’s IPO market affected by market volatility
Recent elevated market volatility from geopolitical tensions unsurprisingly impacted EMEIA equity markets and subsequent corporate activity. Many IPO candidates in the region postponed their IPOs until a clearer picture emerges on the economic outlook. Overall EMEIA saw 96 IPOs, a decline of 38% YOY, proceeds raised were US$9.3b, a 68% decline YOY. On a more positive note, the global financial markets remain open and functioning despite the continued uncertainty.
In the first quarter of 2022, Europe accounted for 15% of global IPO deals and only 5% by proceeds. Deal numbers in Europe were 47 with proceeds of US$2.7b raised. Two European exchanges were among the top 12 exchanges by deal numbers and by proceeds raised.
Shift in sector performance
The first quarter saw some slight shifts in sector performance partly due to the changing economic environment and market conditions. Both the technology and materials sectors led by number of IPOs with 58 each, raising US$9.9b and US$5.9b, respectively. This was followed by industrials (57 IPOs raising US$5b). Technology continued its dominance by deal numbers for the seventh consecutive quarter (since Q3 2020) but ranked second by proceeds – breaking a streak of seven consecutive quarters raising the highest IPO proceeds since Q2 2020.
In Q1 2022, energy took the lead in terms of proceeds (US$12.2b via 15 IPOs), driven by Q1’s largest IPO on the Korea Exchange, while telecommunications came third (US$8.6b via six IPOs) due to Q1’s second largest IPO on the Shanghai Stock Exchange.
Commenting on the findings, Stelios Demetriou, Partner and Head of Strategy and Transactions Services of EY Cyprus said: “The market shock from geopolitical tensions in the second half of the quarter, especially in Europe, along with other economic concerns, including about inflation and interest rate hikes, created volatility and impacted the capital markets. As this is unlikely to change in the short term, the pipeline of IPO candidates will continue to build up. Companies will need to be well prepared to access the market when the window opens, carefully review their business models and prepare alternative fund-raising plans.”
-ends-


