8 minute read 25 Aug 2022
Indian economy in 2050

Indian economy by 2050: In pursuit to achieve the $30 trillion mark

By D. K. Srivastava

EY India Chief Policy Advisor

A noted economist, D.K. Srivastava is an Honorary Professor at Madras School of Economics and Member of the Advisory Council to the 15th Finance Commission.

8 minute read 25 Aug 2022
Related topics Tax COVID-19

Show resources

India to reach US$5, 10, 20 and 30 trillion by FY27, FY34, FY43 and FY48, respectively.

In brief

  • The UN World Population Prospects 2022 projects India to have the largest population by 2023.
  • As per OECD’s baseline projections, India would overtake the US to become the second largest economy in terms of size of GDP in purchasing power parity (PPP) terms by the late 2040s. 
  • However, with suitable supporting policies and altering some of the OECD assumptions, India’s GDP growth path may be modified with a view to taking better advantage of the unfolding population trends.

From population to output

In the assessment of India’s growth potential, one key determinant as well as an important objective variable is the availability of human resources, which pertains to the size and growth in the working age population of India. The potential contribution of the growing population to India’s GDP growth would depend, among other factors, on the rate of growth and size of total population and its contribution to the size of working age population who may be absorbed in productive employment. It would also depend on increase in labor productivity and the impact of rising per-capita income on savings and capital formation. The working age population is estimated to decline at a rate lower than that of total population. Even as working age population declines over time, its adverse impact on potential growth rate can be overcome by its higher rate of absorption in productive employment and an increase in productivity. Absorption in productive employment and increase in labor productivity would depend an increase in the employment elasticity of output and higher investment in human capital, requiring a significant augmentation of education and health expenditures.

Future share and size of the Indian economy: alternative scenarios

The OECD focuses on projecting the potential or trend output growth based on a long-term model in which the key determinants of growth include growth of capital stock and its productivity, growth of labor force and its productivity, and the pace of technological progress (Guillemette and Turner, 2018; Johansson A. et al., 2013; OECD, 2014)1.

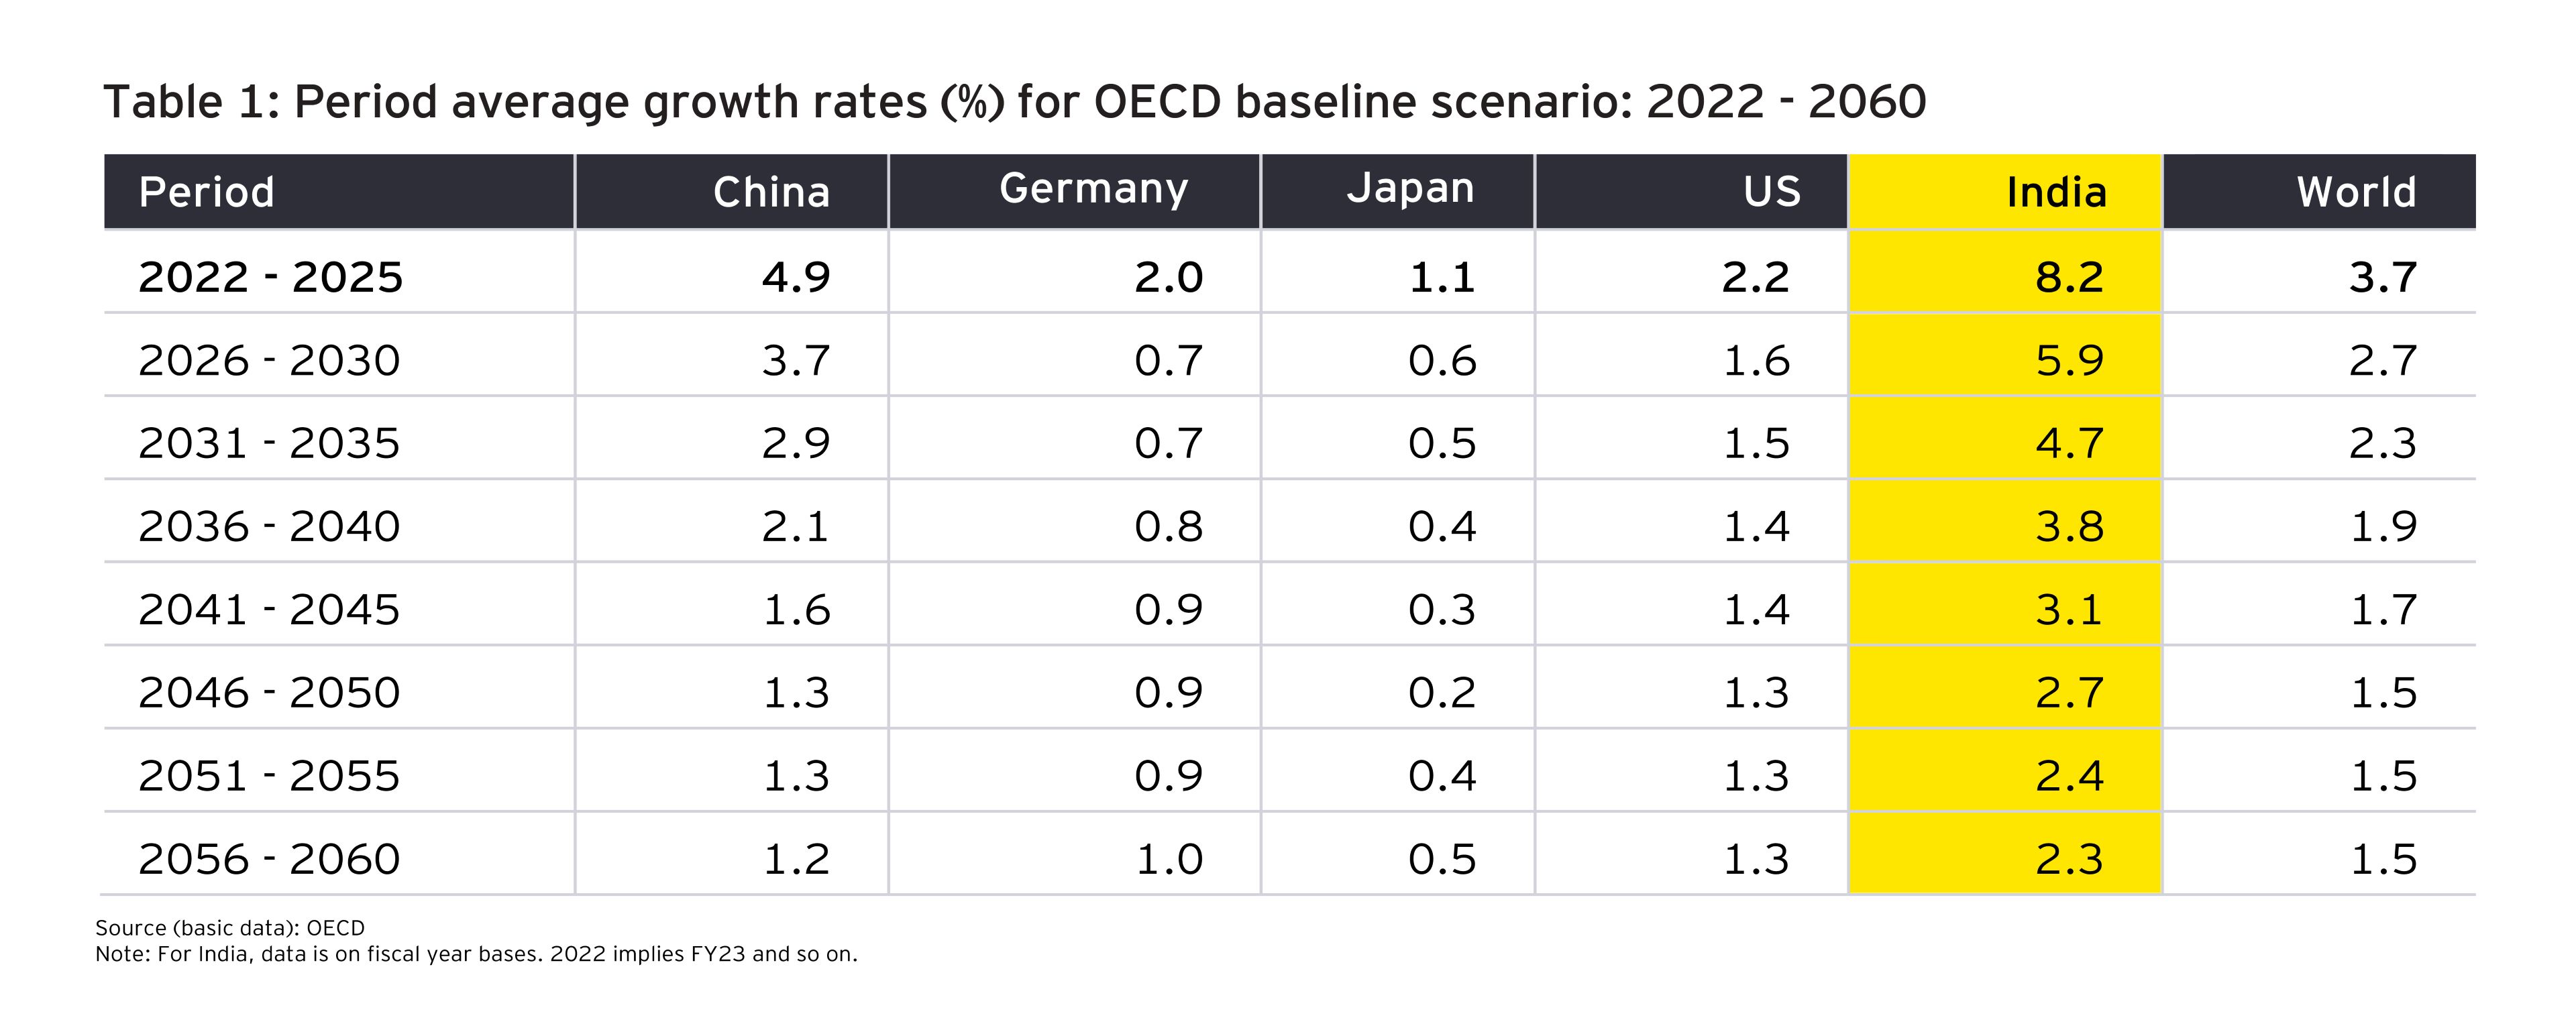
Table 1 below gives the estimated growth rates for a selected group of countries in the OECD baseline scenario. In the case of world, China, India and the US, average growth rates progressively fall, decade after decade, although the rate of this decline slows after the 2030s. The main reason for the falling growth rates is the declining marginal productivity of capital and reduced contribution of the technological progress. 

Period average growth rates (%) for OECD baseline scenario: 2022 to 2060

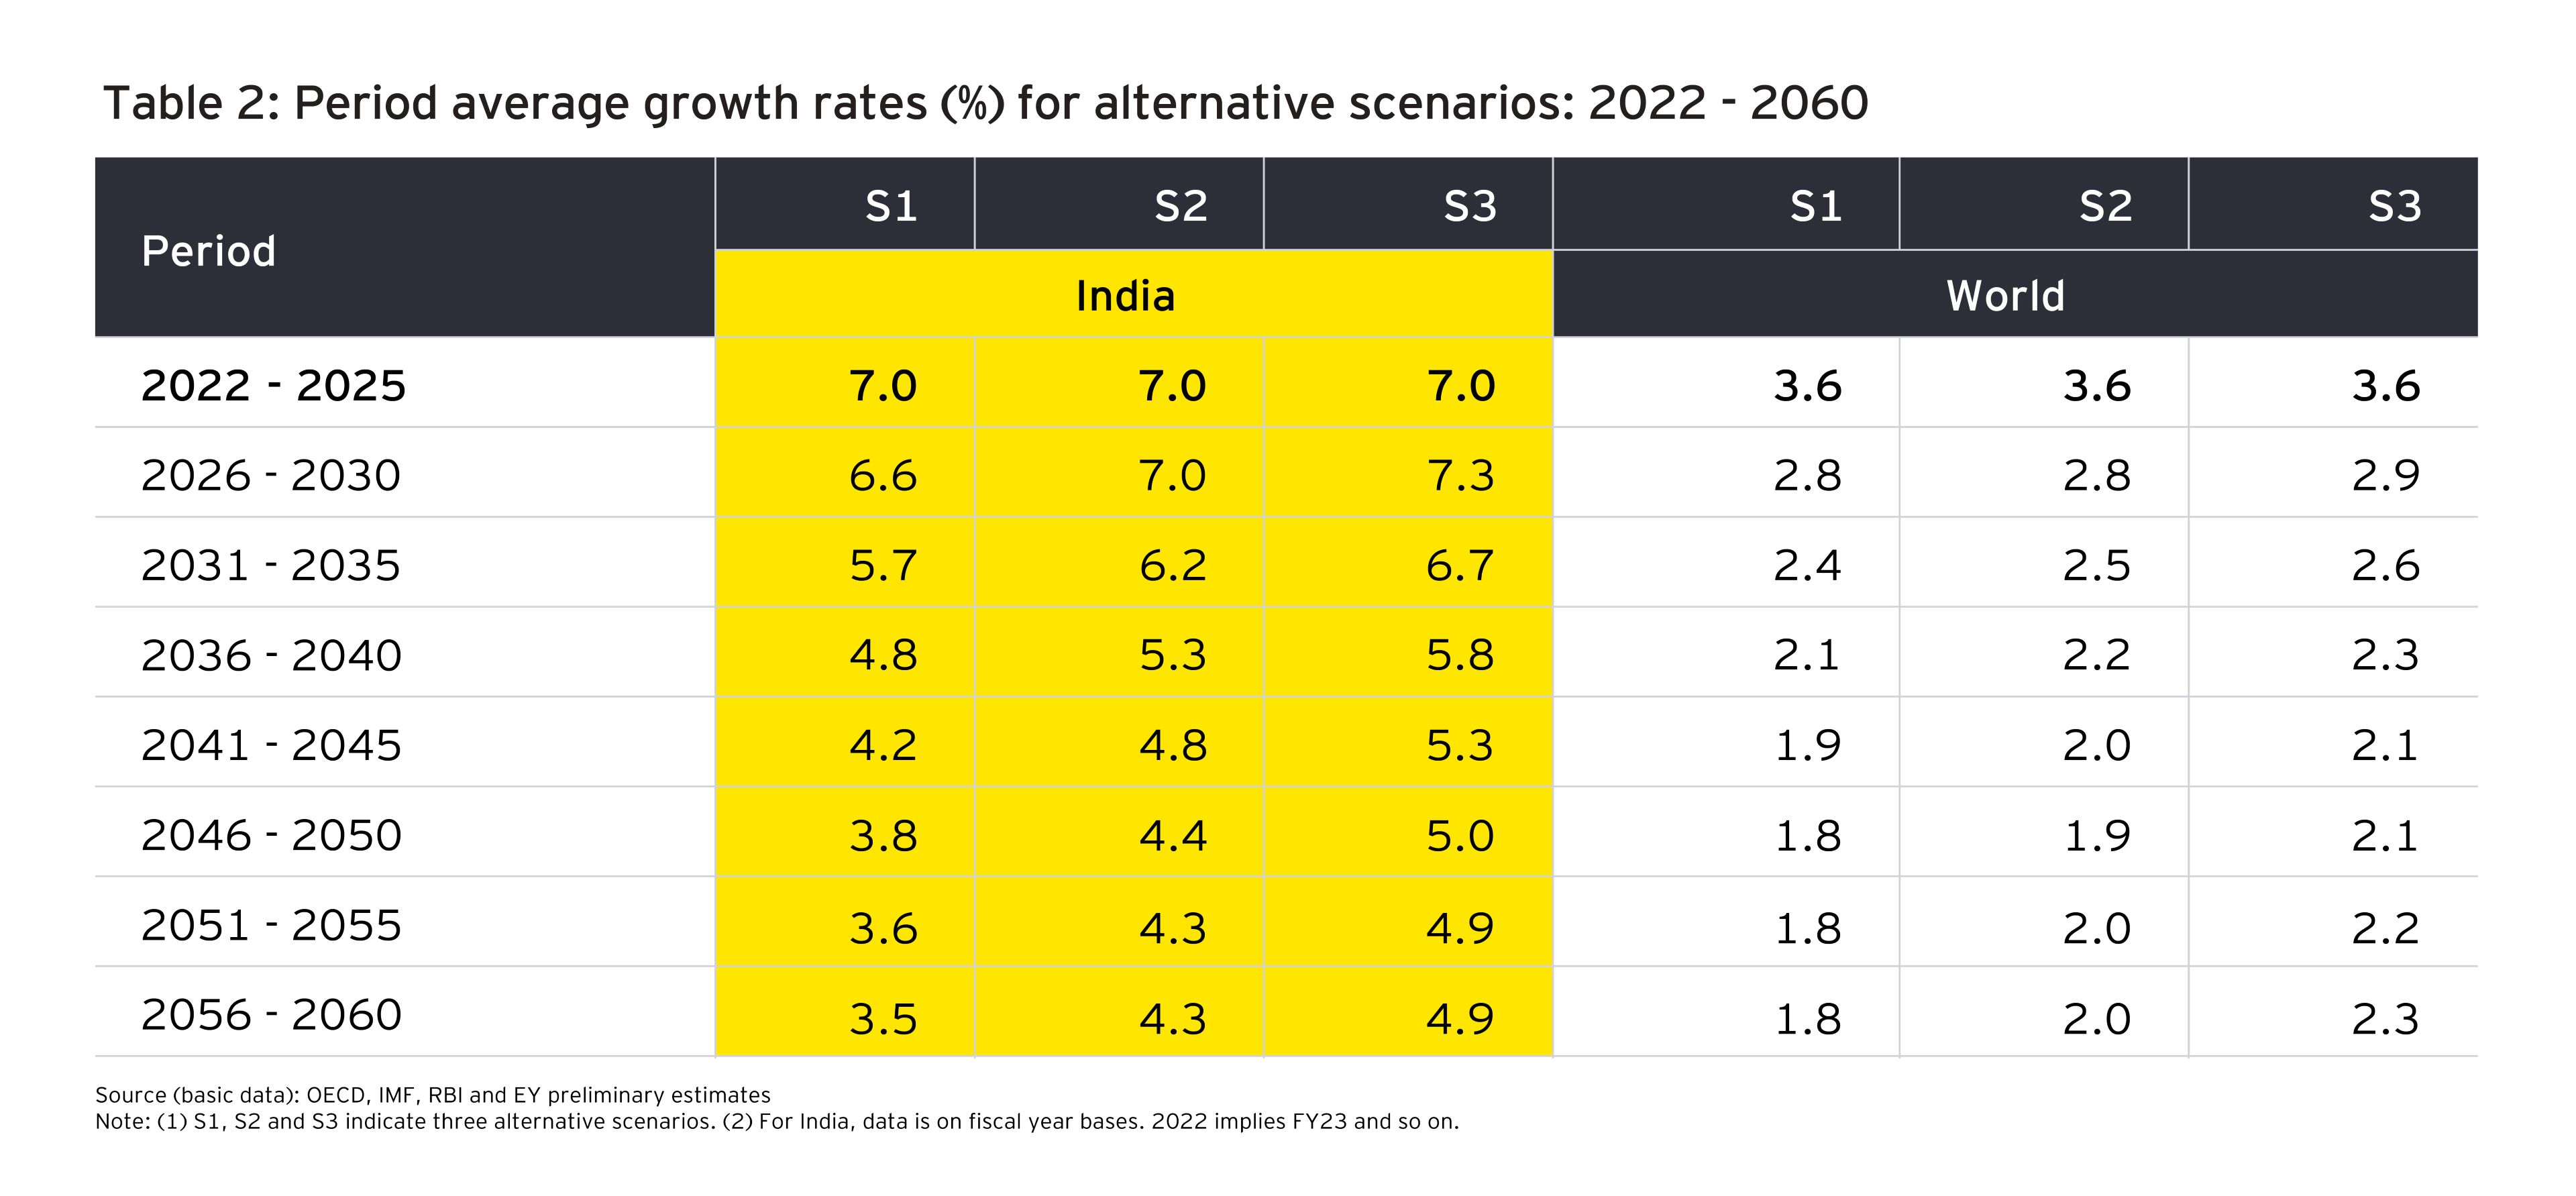
As compared to the average growth rates given in Table 1 for India, we work on alternative growth paths for India, leaving projections for other countries as per the OECD baseline scenario (Table 2). However, the world growth and India’s share in world output changes with each simulation as the share of India in world output increases. In the initial period covering 2022 to 2025 (FY23 to FY26 for India), we have taken a lower average growth for India as compared to the OECD projections based on more recent information (RBI Monetary Policy Review, August 2022 and IMF World Economic Outlook, April 2022).

However, 2026 (FY27) onwards, in each of the three simulations (S1, S2, and S3), there may be a slight increase in India’s assessed average growth as compared to the OECD baseline scenario. This is dependent on India taking fuller advantage of the population growth trends, which results in both increased rate of accumulation of capital stock and increased employment. If India is able to follow suitable growth-supporting policies, its average five-year growth rates would turn out to be higher than those projected by the OECD, especially in the latter decades. However, in each scenario, average five-year growth rates continue to fall, similar to the trend in the OECD baseline scenario. Thus, in the most optimistic scenario (S3), the average growth rate in the 2050s is 4.9% each in the two five-year blocks as compared to the OECD projections of 2.4% and 2.3%, respectively. 

Period average growth rates (%) for alternative scenarios: 2022 to 2060

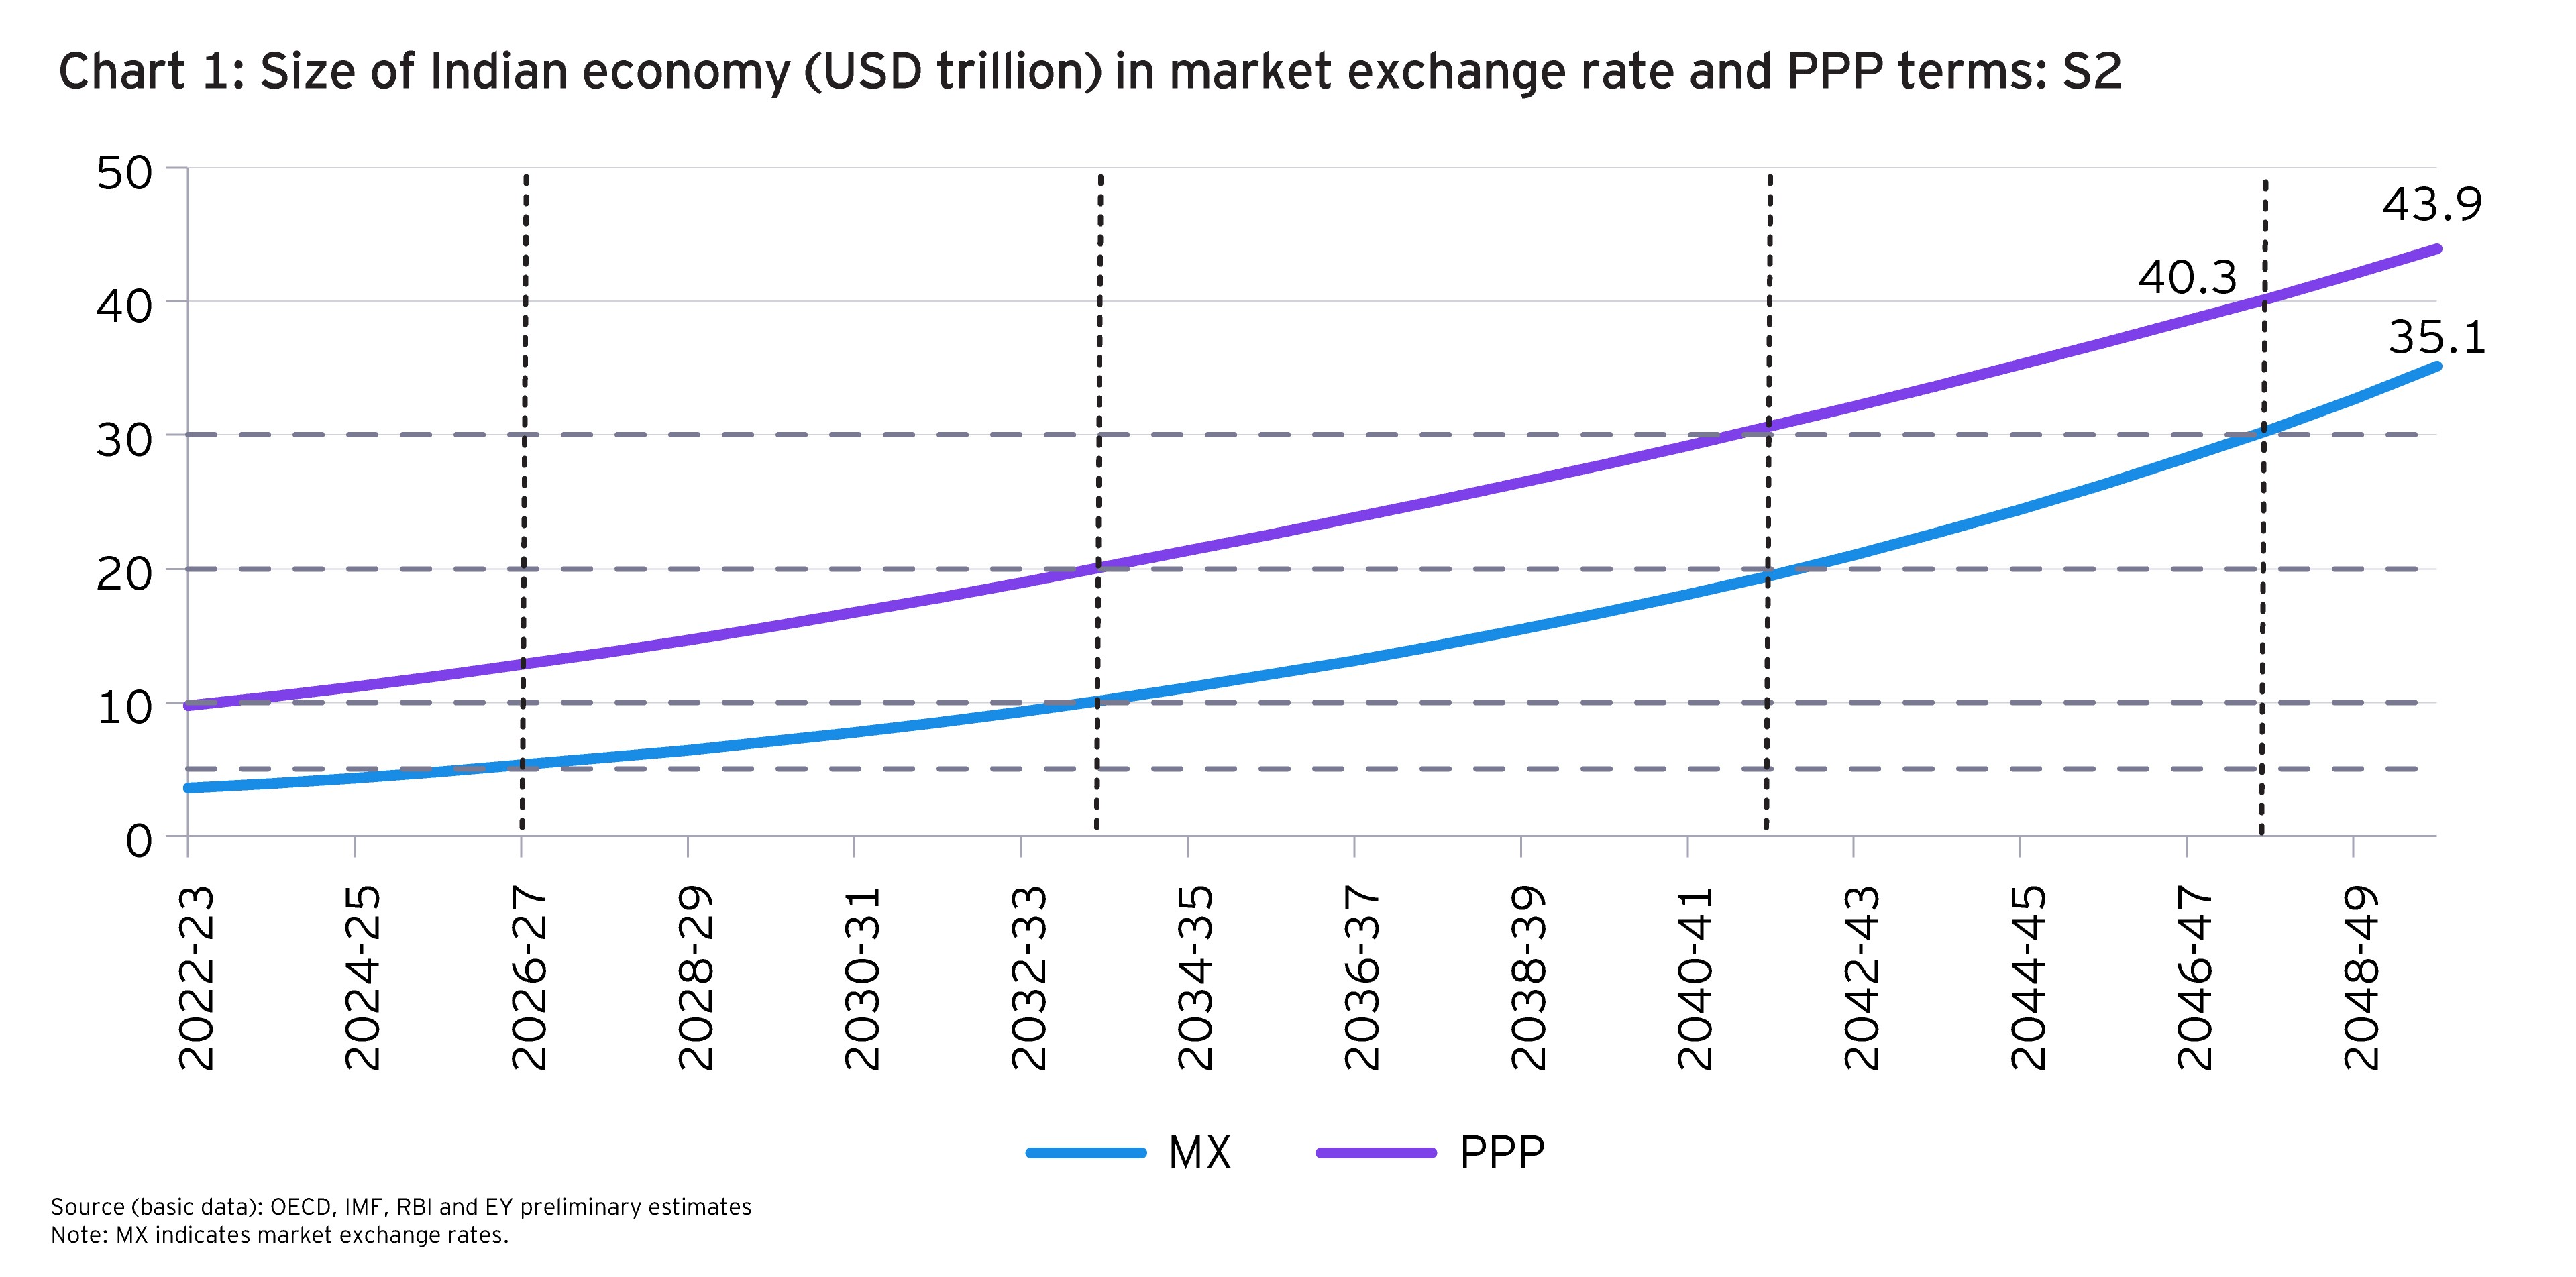
Based on these projections, we can work out the size of the Indian economy in market exchange rate and PPP terms as well as the share of the Indian economy in global GDP. Chart 1 below shows the evolving size of the Indian economy in both market exchange rate and PPP terms. In Market exchange rates terms, the Indian economy would cross the thresholds of US$5, 10, 20 and 30 trillion in FY27, FY34, FY43 and FY48, respectively. We expect that by FY48, in PPP terms, India’s GDP may reach the US$40 trillion mark. Consistent with this scenario (S2), the share of India in world GDP is shown in below Chart 2. By 2047 (FY48 for India), India’s share may increase to 19.6%.

Size of Indian economy (USD trillion) in market exchange rate and PPP terms
Share in global GDP (%) - S2

Accordingly, India’s per capita GDP which is almost 50% of the world per capita GDP in PPP terms currently (FY22 and FY23) would catch up to the world level by the early 2040s. This would become 1.5 times the world per capita GDP by 2057 (FY58) under S2.

Indian economy: the long picture

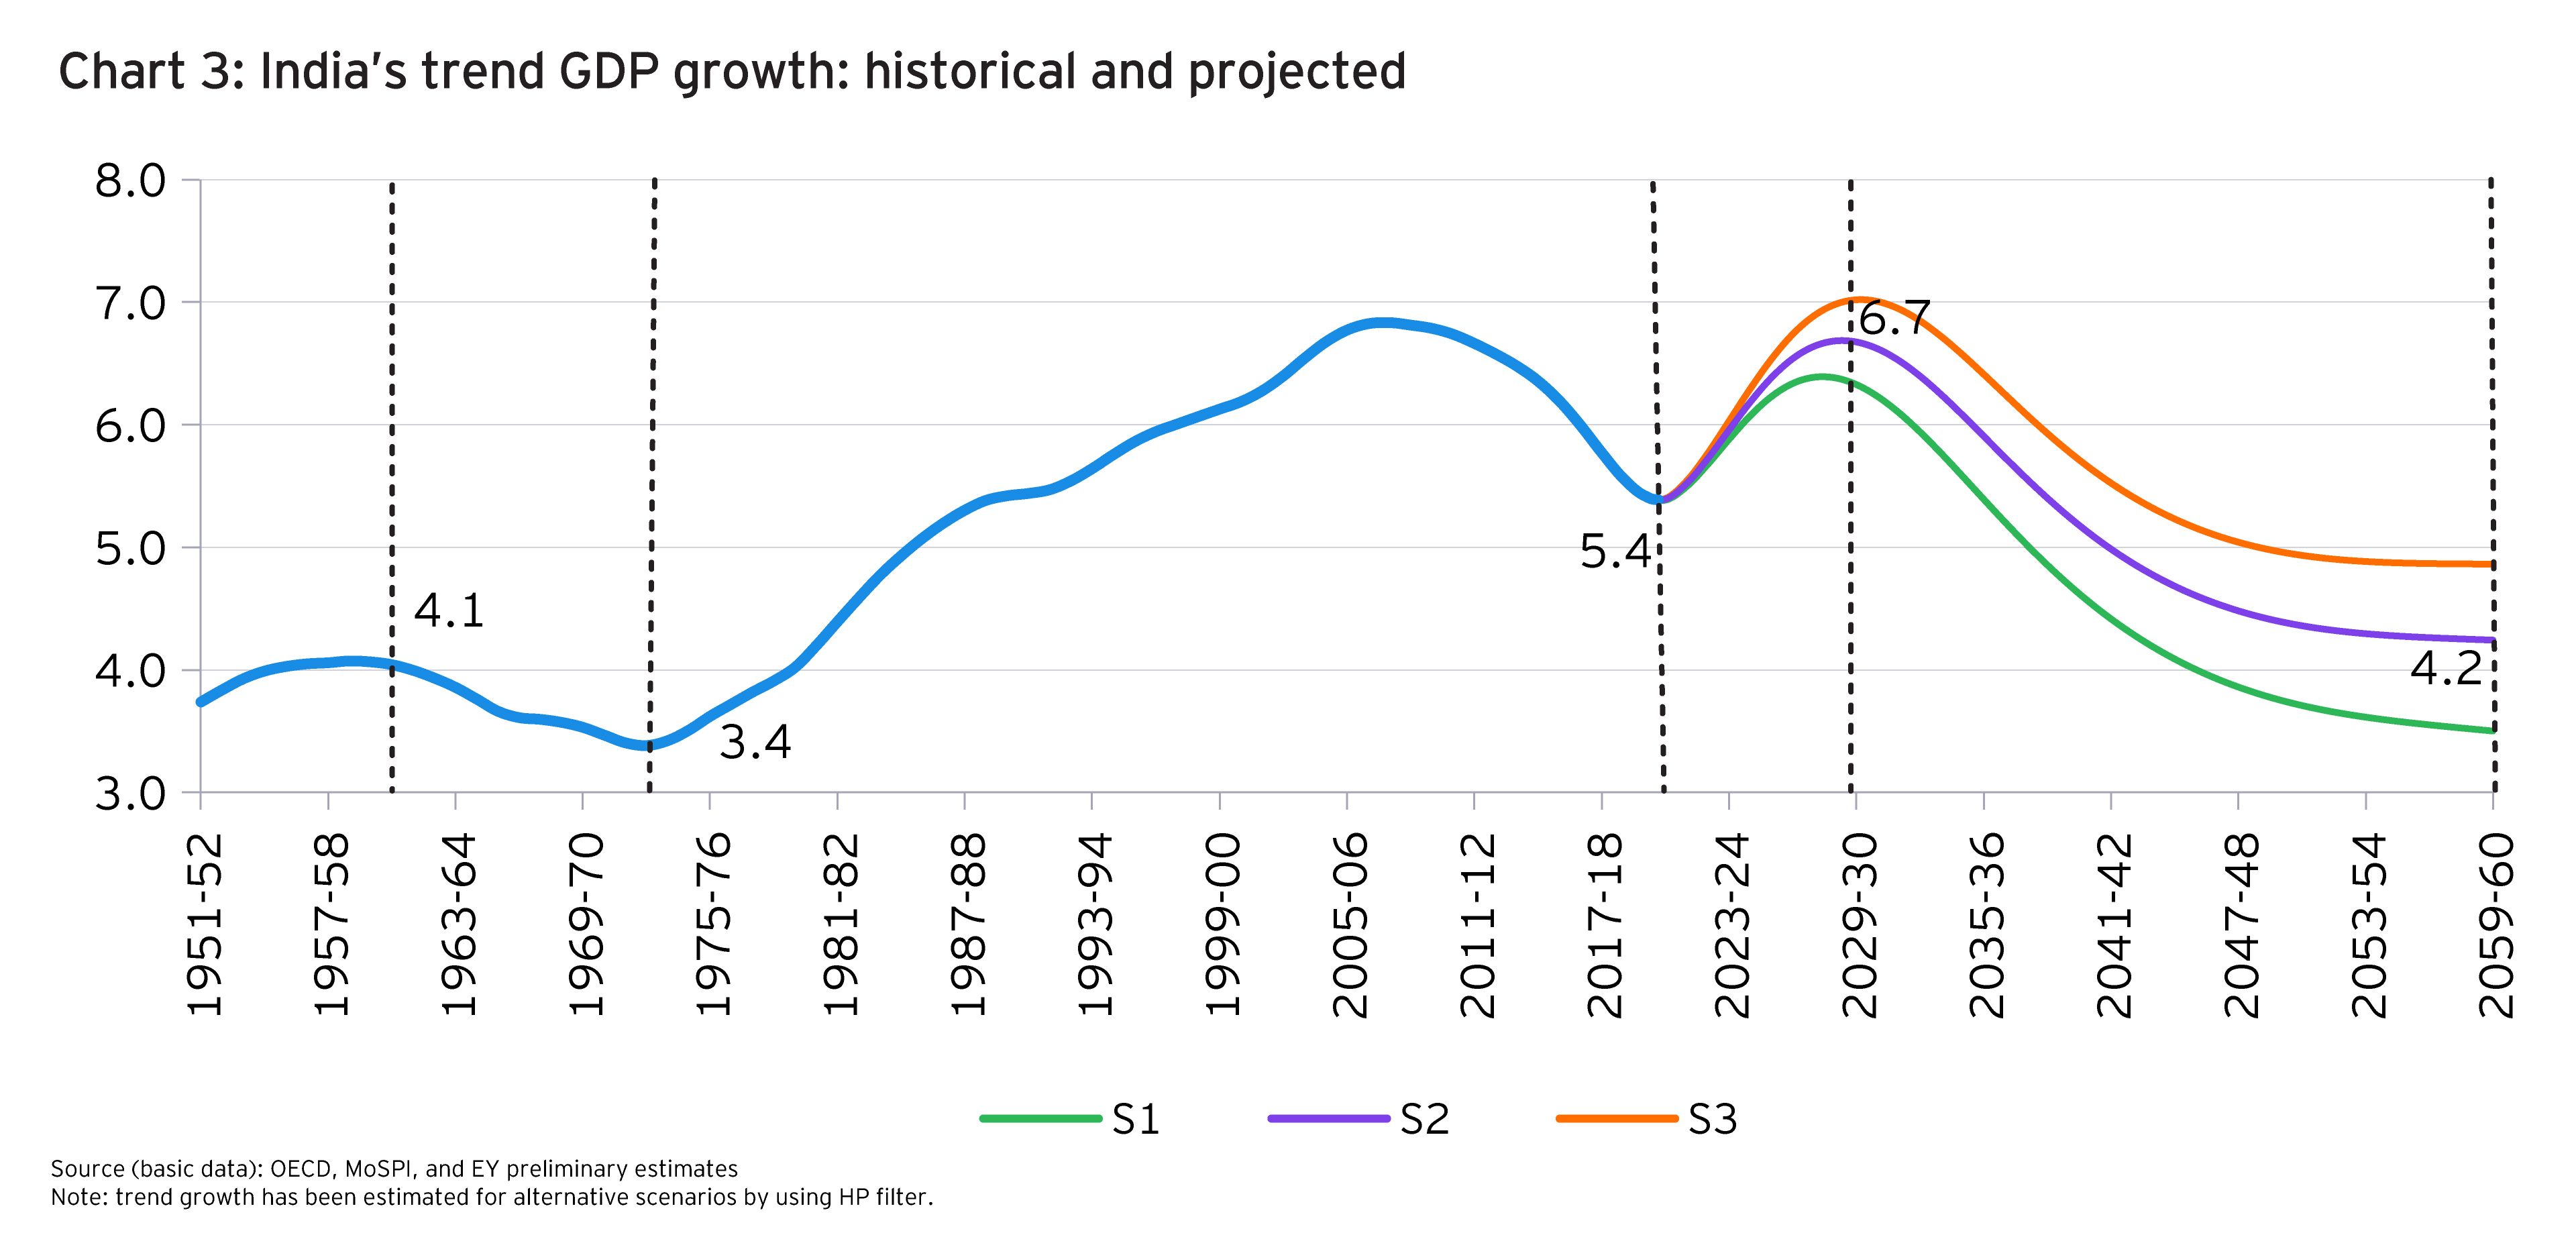
We take a long-term view of India’s trend growth rate based on actual growth and estimated potential growth covering a period of more than 100 years from 1951-52 to 2059-60. Growth numbers 2022-23 onwards are based on simulations under alternative assumptions, referred to as S1, S2 and S3. In this long history two major dips occur in 1972-73 and more recently, in 2020-21 pertaining to the year affected by the COVID-19 shock. In the historical period there was a peak in trend growth in 1958-59 and then in 2008-09. In the projection period, in all simulations, a peak in the trend growth rate of close to 7% is reached by 2029-30 after which there is a steady decline just as in the case of OECD projections where growth rate falls for most countries in the long run due to a fall in the contribution of capital stock to growth, among other factors.

India’s trend GDP growth: historical and projected

Determining policy priorities

The following policy measures may be critical to sustain India’s growth:

  1. There is a need to increase the size of government expenditure relative to GDP for which augmenting the combined tax-GDP ratio is a pre-requisite. Further, there should be an increase in the share of combined expenditure on education to 6% of GDP and on health to 3% by the mid-2030s, rising subsequently to about 5%.
  2. Alongside, adherence to fiscal responsibility may facilitate higher emphasis on infrastructure investment. Further, the fiscal policy should also ensure a balance on the combined government revenue accounts and utilization of the entire capital receipts, including fiscal deficit for capital expenditure.
  3. Female workforce participation rate in India is still comparatively low. As per International Labour Organization (ILO) data, India’s female labor force participation rate has been declining in recent years. The ILO has estimated this rate to be as low as 18.6% in 2020. Emphasis on female education and health may help tangibly increase their participation in productive activities.
  4. Emphasis on better health provisions may enable an increase in the number of working years for India’s gradually rising old age population.
  5. Investment in education and technological skills would accelerate adoption of global technologies in India, thereby augmenting the contribution of technological progress to growth.
  6. A virtuous cycle of higher per capita income, lower dependency ratio, and higher female earnings in the family may facilitate higher savings and investment, and thereby growth.
  7. Overall, employment intensity of output needs to be increased. To some extent, this would be facilitated by the relatively higher growth of the services sector, which tends to be more employment intensive.

Show resources

Summary

India needs several supporting government policies to become the second largest economy in PPP terms by 2040. Increasing the size of government expenditure relative to GDP and prioritizing public expenditure on education, health and physical infrastructure are key steps that the government can take in this regard.

About this article

By D. K. Srivastava

EY India Chief Policy Advisor

A noted economist, D.K. Srivastava is an Honorary Professor at Madras School of Economics and Member of the Advisory Council to the 15th Finance Commission.

Related topics Tax COVID-19