9 minute read 7 Jul 2017
The rapid emergence of FinTech

The rapid emergence of FinTech

By Ichiro Sugiyama

EY Japan Forensic & Integrity Services Technology Team Leader

One of the pioneers in the early stage of digital forensic technology in Japan. Loves family and camping.

9 minute read 7 Jul 2017
Related topics Growth

The rapid increase of FinTech* firms operating in the financial services industry, and the corresponding VC and corporate investment in this sector, has attracted significant attention from both industry observers and the media.

*FinTech: organizations combining innovative business models and technology to enable, enhance and disrupt financial services.Our definition refers to an industry that includes not only early-stage start-ups and new entrants, but also scale-ups, maturing firms and even non-financial services firms

We launched the first EY FinTech Adoption Index in 2015 to cut through the hype and understand whether digitally active consumers were actually using FinTech services on a regular basis. The answer at the time was yes: 16% of our surveyed consumers had used two or more FinTech services in the prior six months, with adoption potentially doubling in the near future. The 2017 study reveals that this has happened in just 18 months.

Findings from the 2017 study show that FinTech firms have reached a tipping point, and are poised for mainstream adoption across our 20 markets. Building upon the strength of their core characteristics of focusing on the customer proposition and leveraging technology in novel ways, FinTech firms are gaining traction in the market. In the process, they are blurring boundaries between financial products and lifestyle propositions, as well as defining new standards within financial services.

FinTech firms share two core characteristics: a laser-like focus on the customer proposition and a willingness to apply technology in novel ways. These are powerful differentiators in a marketplace where many product-focused incumbent financial services companies struggle to deliver the seamless and personalized user experiences that consumers increasingly expect.

Consumers are drawn to FinTech services because propositions are simpler, more convenient, more transparent and more readily personalized. This has a ripple effect across the industry as consumers come to expect these characteristics in all financial products, regardless of whether in retail banking, wealth management or insurance, and of who is providing the service.

  • Report highlights

    Findings from the 2017 EY FinTech Adoption Index include:

    • 33% is the average FinTech adoption globally, compared with 16% in our 2015 study.1
    • 46% is the average FinTech adoption across emerging markets: Brazil, China, India, Mexico and South Africa.
    • 50% of consumers use FinTech money transfer and payments services, and 65% anticipate doing so in the future.
    • 64% of FinTech users prefer using digital channels to manage all aspects of their life, compared with 38% non-users.
    • 13% of consumers are regular users of five or more FinTech services (FinTech "super users").

Methodology

We identify 17 distinct services offered by FinTech organizations and non-traditional providers, and refer to these as FinTech services. These services are considered within the five broad categories of money transfer and payments, financial planning, savings and investments, borrowing, and insurance.

We define a regular FinTech user as an individual who has used two or more FinTech services in the last six months.

Our 2017 research is based on more than 22,000 online interviews in 20 markets. Our surveyed population is drawn from a demographically representative sample of each market to the extent available, and all references to consumers relate to individuals who are active online, which we refer to as “digitally active” in this report.

We have applied unweighted averaging of results, using a “one market, one vote” approach to report findings, to offer a global, cross-market perspective on themes and trends. The 20 markets are Australia, Belgium and Luxembourg (considered as one market for the purpose of our analysis), Brazil, Canada, China, France, Germany, Hong Kong,2 India, Ireland, Japan, Mexico, the Netherlands, Singapore, South Africa, South Korea, Spain, Switzerland, the UK, and the US.

Four key consumer themes emerged from the 2017 EY FinTech Adoption Index

EY FinTech Adoption Index 2017
  1. FinTech has achieved initial mass adoption in most markets
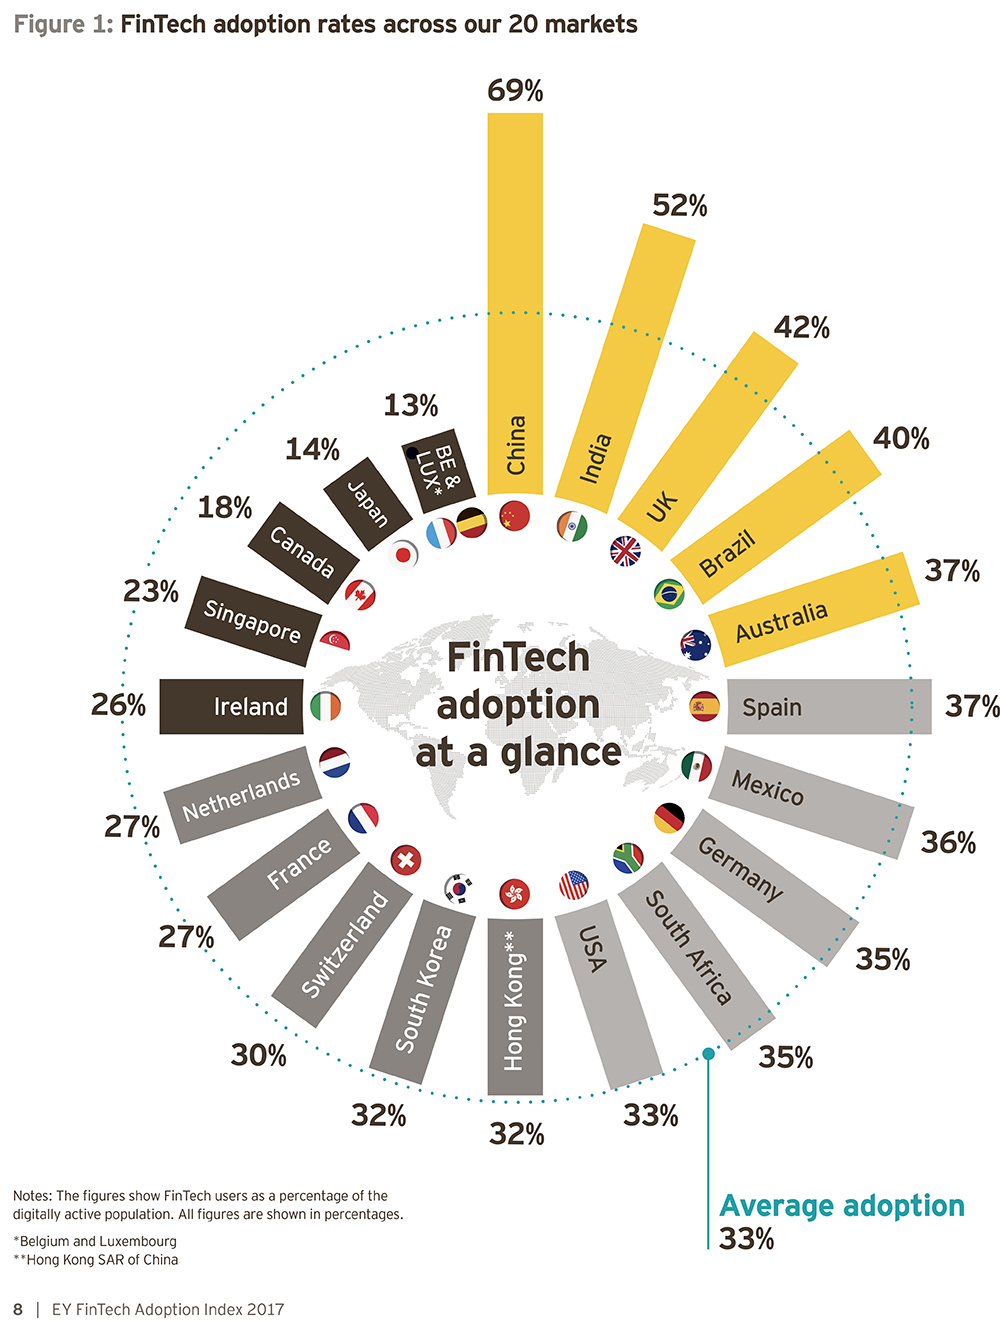
    The average percentage of digitally active consumers using FinTech services reached 33% across the 20 markets. Benchmarked to academic theory on innovation adoption, it suggests that FinTech services have reached a milestone in being adopted by the “early majority” of the population.3 There is evidence of increasing awareness: for the six markets where a comparison is available, 84% of customers are aware of FinTech services in 2017 compared with 62% in 2015.

    This is driven in part by the emerging markets in our study: FinTech adoption by digitally active consumers in Brazil, China, India, Mexico and South Africa average 46%, considerably higher than the global average. From an individual market perspective, China and India have the highest adoption rates at 69% and 52% respectively. This is because FinTech firms excel at tapping into the tech-literate but financially underserved population, of which there are particularly high ratios in emerging countries.

  2. New services and new players are driving higher adoption
    Among our five categories, money transfer and payments are driving FinTech adoption. 50% of our digitally active consumers have used this type of service in the last six months, which suggests this category has reached “late majority” adoption. Insurance services have also seen significant increases, overtaking both savings and investments, and borrowing, with 24% adoption.

    One potential influence may be attributed to the greater activity from regulators and policymakers in some markets that support FinTech, such as in money transfer and payments, as well as insurance services. These groups are addressing new business models and technologies that were previously undefined by the current regulatory framework, setting up initiatives such as steering groups and sandboxes, updating licensing regulations, and introducing infrastructure changes that facilitate open APIs.

  3. FinTech users prefer using digital channels and technologies to manage their lives
    Unsurprisingly, use of FinTech products and services is higher among younger consumers. Those with the highest use, 25- to 34-year-old consumers, are not only tech-savvy “digital natives,” but are also at the age where they have a greater need for financial services. In some markets, they have not developed many strong relationships with incumbent providers, and are willing to consider non-traditional options as alternatives.

    FinTech users (across all ages) share similar views toward personal risk, and are equally likely to read the terms and conditions of new products or worry about personal data security. However, 64% of FinTech users prefer managing their lives through digital channels, compared to 38% of non-FinTech users; FinTech users are also more likely to be users of non-FinTech platforms, such as on-demand services and the sharing economy.

  4. FinTech adoption will continue to gain momentum
    FinTech adoption is expected to increase in all 20 markets, with a segment of current non-FinTech users shifting to FinTech services in growing numbers. On the basis of anticipated future use, FinTech adoption could increase to an average of 52% globally, with the highest intended use among consumers in South Africa, Mexico and Singapore.

    Borrowing and financial planning are anticipated to more than double in usage. Money transfer and payments services remain the most widely used at 50%, with anticipated future use by 65% of consumers.

    FinTech users are also becoming more diverse in their use of services, with 13% of those surveyed becoming super-users who regularly use five or more FinTech services.

Reaching 33% adoption: how FinTech firms achieve traction

In addition to the macroconsumer trends observed in the EY FinTech Adoption Index, we also review from a business perspective how FinTech firms achieve consumer traction in ways that differ from traditional firms.

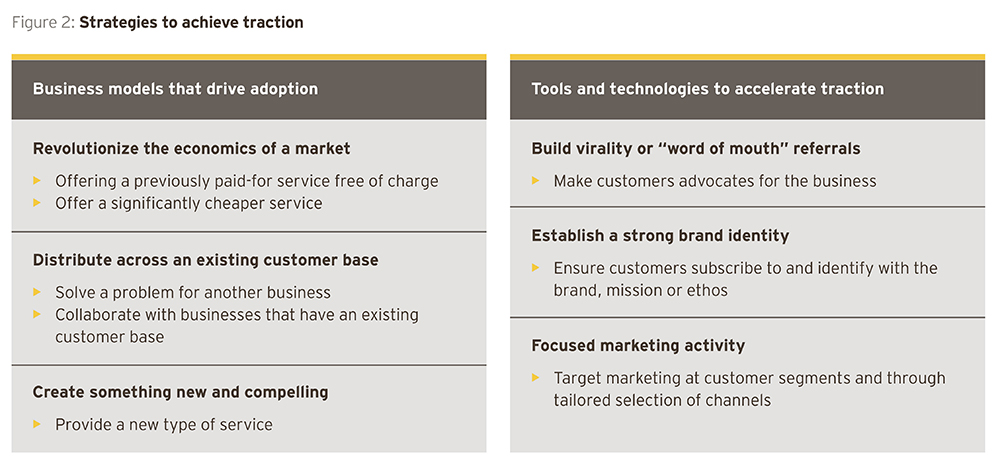
FinTech firms build traction into the heart of their business model by focusing on the customer proposition and enabling technologies. A combination of traditional and non-traditional tools drives growth until they are able to reach sustainability.

EY FinTech Adoption Index 2017

FinTech in perspective

FinTech firms are establishing themselves not only as significant players in the industry, but also as the benchmark for financial services. Their new propositions are increasingly attractive to consumers who are underserved by existing financial services providers, and their use will only rise as FinTech awareness grows, consumer concerns fall, and technological advancements, such as open APIs, reduce switching costs.

Established financial services firms face both “unbundling” and “rebundling” of their propositions resulting in disruption of traditional customer relationships. However, this also creates opportunities for start-ups and established firms to collaborate. Investment and regulatory support will continue to play a role in stabilizing the development of the FinTech industry, which will benefit consumers.

We asked the leaders of FinTech firms from different regions, and at different levels of maturity, for their perspectives on customer traction.

Even though it’s easier said than done, the best thing to do is to build a product that resonates clearly with people’s needs. Once you have that, your early adopters will recommend you to their friends and, in today’s environment, you can quickly get viral growth through word of mouth.
George Lucas
Founder and CEO, Acorns Australia
We believe in the power of tech. By using it well and by working closely with our financial and strategic partners around the world, we aim to bring equal access to financial services to over two billion people in 10 years
Eric Jing
CEO, Ant Financial
For propositions to tip into the mass market, they need to be incredibly simple; even an elevator pitch is too complex. Ideally, propositions should be under 10 words. ClearScore’s proposition is, ‘Your credit report and score, for free, forever.
Justine Basini
Founder and CEO, ClearScore
Achieving customer adoption means different things at different stages. From the beginning, it pays to be focused — to have one thing that hits the pain point of customers and attracts them to the platform. For Lufax, peer-to-peer (P2P) was that star product, and Ping An was crucial to gaining customer comfort and traction at the beginning.
Gregory Gibb
Founder and CEO, Lufax
We built Nubank despite all conventional wisdom, in the midst of Brazil’s worst economic crisis. Today, more than nine million people have applied for Nubank. These results should motivate every entrepreneur to keep challenging the status quo.
David Vélez
Founder and CEO, Nubank
PayPal is uniquely positioned to solve issues that others cannot, particularly as consumers and merchants increasingly connect over mobile and social media. We lead the way toward an overwhelmingly mobile future.
Bill Ready
COO, PayPal
Unlike traditional broking firms, we keep our operations online and pass benefits back to our clients as lower costs. This edge of being a tech firm has helped us scale our business to one of the largest brokerage firms in India in terms of retail trading turnover.
Nithin Kamath
Founder and CEO, Zerodha

Footnotes

1 The number of markets covered in our survey has expanded. Our 2017 study presents FinTech adoption across the 20 markets surveyed of 32.8%. Our 2015 study covered six markets and used a different, population weighted average, which was 15.5% across the six markets. For comparison purposes, applying the 2015 methodology and set of six markets to the 2017 survey data also results in an average adoption of 33.2%. All figures have been rounded to the nearest whole percentage in this report.
2 Hong Kong SAR of China.
3 For further details, see Everett M. Rogers, Diffusion of Innovations, (Free Press, 5th edition, 17 November 2003).

Summary

Read the wider EY FinTech Adoption Index 2017 here.

About this article

By Ichiro Sugiyama

EY Japan Forensic & Integrity Services Technology Team Leader

One of the pioneers in the early stage of digital forensic technology in Japan. Loves family and camping.

Related topics Growth