- Global IPO activity dampened amid ongoing geopolitical and trade uncertainty
- Americas builds momentum while Asia-Pacific and EMEIA cool
- Technology, industrials and health care were the most active sectors in Q3 2018
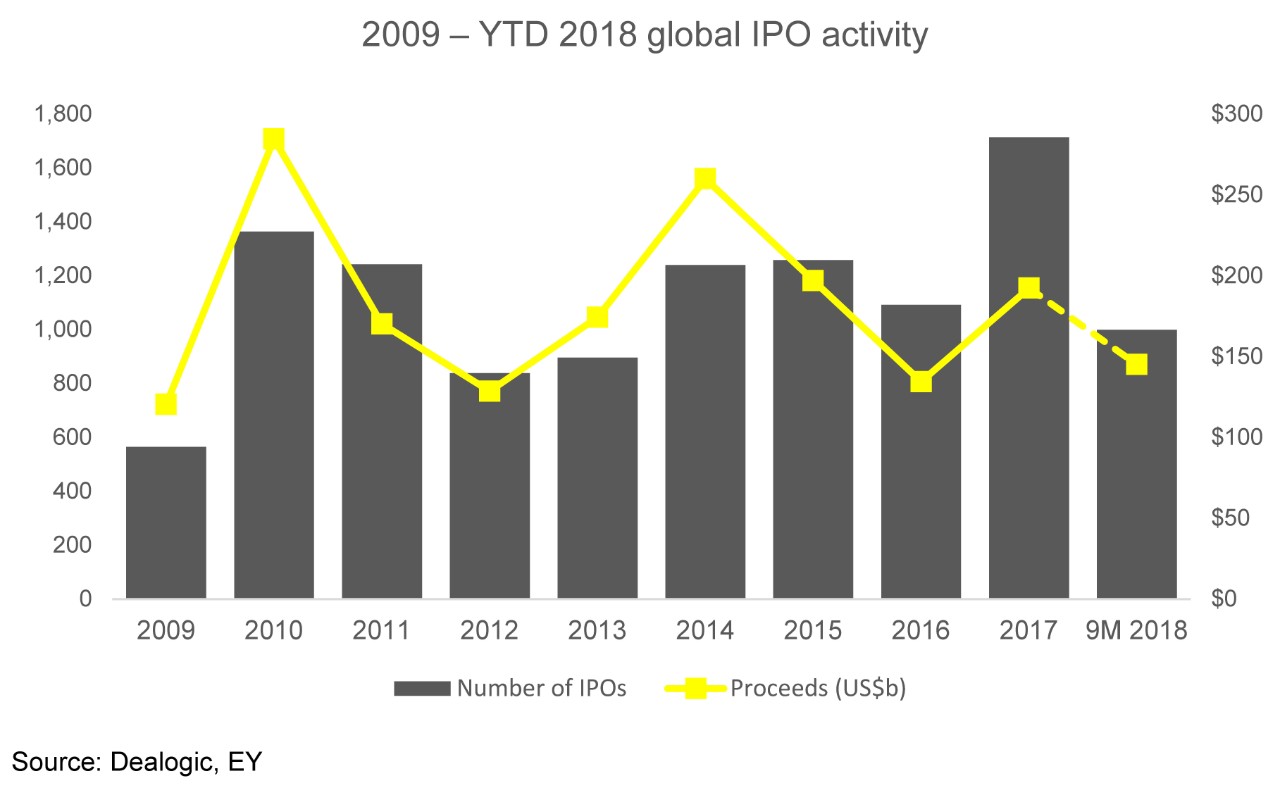
Ongoing geopolitical uncertainties and trade issues continue to dampen investor enthusiasm, resulting in the number of IPOs in the first nine months of 2018 (YTD 2018) falling to 1,000 globally. This is an 18% decrease from YTD 2017, which saw the highest nine-month activity since YTD 2007. However, despite this slowdown, YTD 2018 activity remained above the 10-year average with global IPO markets raising US$145.1b, a 9% increase year-on-year.
Activity in Q3 2018 (302 IPOs and proceeds of US$47.1b) was 22% lower in deal volume and 9% higher by proceeds compared with Q3 2017. The technology, industrials and health care sectors were the most prolific producers of IPOs globally in YTD 2018, together accounting for 468 IPOs (47% of global IPO by deal numbers) and raising US$62.9b altogether (43% of global proceeds). Additionally, an increase in unicorn IPOs in Q3 2018 pushed YTD 2018 global IPO proceeds 9% above YTD 2017. These and other findings were published today in the EY quarterly report, Global IPO trends: Q3 2018.
Dr. Martin Steinbach, EY Global and EMEIA IPO Leader, says:
“The third quarter has lived up to expectations as the quietest period of the year with the global IPO market feeling the full force of geopolitical tensions, trade issues between the US, EU and China and the looming exit of the UK from the European Union. However, if megadeals characterized the first half of 2018, the rising phenomenon of IPOs by unicorn companies is shaping up to drive the global IPO agenda through the second half of 2018, and we anticipate that 2018 global proceeds will surpass 2017 numbers as a result. Overall deal volumes in 2018, however, will likely be lower year-on-year than in 2017.”
Americas IPO momentum builds
Americas IPO activity remained strong in YTD 2018, with deal proceeds increasing 41% to US$50.1b and deal numbers rising by 27% to 195 IPOs. The US saw 47 IPOs in Q3 2018 raising US$11.9b, an increase of 150% by proceeds and 31% by volume compared with Q3 2017.
IPOs in the US posted average first-day returns of approximately 15% and the average current share price post-IPO was up by 28%. Cross-border deals accounted for 31% (18 IPOs) of the Q3 2018 deals in the Americas, signaling increased confidence in the Americas exchanges.
The NYSE and NASDAQ ranked among the top three exchanges by proceeds globally in YTD 2018, while Mexico‘s Mexican Stock Exchange saw proceeds increase by 70% to US$2.9b in YTD 2018 compared to YTD 2017.
Jackie Kelley, EY Americas IPO Markets Leader, says:
“Americas IPO activity remains strong, with both deal volume and proceeds increasing year-to-date. Investor confidence remains solid in the US, with momentum largely the result of post-IPO price performance, which keeps investors engaged and draws more issuers to the market. As we prepare for November’s mid-term elections and the prolific discussions around tax reform 2.0 continue, we may see a tempered US market as we wrap up 2018. However, the steady stream of PE- and VC-backed IPOs in recent months could indicate an influx of unicorn companies coming to market as we head into 2019.”
Asia-Pacific benefits from Hong Kong mega deals
In Asia-Pacific, Hong Kong was the leading story despite cooling activity in the region. Hong Kong’s IPO market experienced sharp spikes in Q3 2018 by both deal number and proceeds, with 18% of IPOs and 49% of global proceeds in Q3 2018. Three mega IPOs (of which two were unicorns) set a record for monthly IPO listings in July, making it this quarter’s most active stock exchange globally. Hong Kong was also the world’s second most popular destination for cross-border IPOs, behind only the US.
Japan continued to perform well in Q3 2018, posting 28 IPOs which is a marked increase from the 17 IPOs seen in Q3 2017. Year-to-date, Japan IPO volumes and proceeds were up 14% and 36%, respectively over the same time period in 2017.
Overall in Asia-Pacific, investor appetite for IPOs was sustained, with YTD 2018 proceeds up 16% on YTD 2017 despite IPO volumes falling 31%. Five of the ten most active exchanges by deal numbers and by proceeds in YTD 2018 were from the Asia-Pacific region.
Ringo Choi, EY Asia-Pacific IPO Leader, says:
“In a normally quiet quarter, Asia-Pacific experienced some exciting IPO activity and we saw the positive impact of new listing regulations on the Hong Kong IPO market. However, IPO activity was also negatively impacted by interest rate hikes and investors looking for interest rate-driven investments, a trend which could continue in 2019. With the launch of a handful of unicorn IPOs on Asia-Pacific exchanges in Q3 2018, we have seen unicorn companies graduate from a state of infancy to one of maturity. As some companies choose to accelerate their IPO timeline to take advantage of current valuations we are likely to see unicorn and mega IPOs pushing 2018 IPO proceeds above 2017’s levels.”
EMEIA activity cools amid listing delays and geopolitical change
In EMEIA, deal volumes and proceeds were down substantially from Q3 2017. EMEIA’s Q3 2018 IPO activity was 48% and 85% lower, respectively than Q3 2017 in terms of number of deals and proceeds. EMEIA 2018 YTD activity was also down, with deal volume and proceeds falling 11% and 24%, respectively on 2017 YTD. However, the region ranks as the second largest and sustainable global IPO market by number of IPOs representing an increased share of 33%.
Average first-day returns for EMEIA main market IPOs was around 12%, while current performance post-IPO increased by 25% on average, signaling that investors remain confident in the IPOs that do make it to market.
Despite a quiet quarter, EMEIA continued to account for three of the top ten exchanges globally by volume (India, Italy and the UK) in Q3 2018 and two exchanges by proceeds (India and the UK).
While continued political stability and a positive economic outlook have increased IPO activity in India, the performance during Q3 2018 was not sustained and Indian IPOs have seen a steep fall in share prices post-IPO over the last two months.
Steinbach says:
“While the EMEIA IPO market felt the force of geopolitical tensions, trade issues between the US, EU and China, and the looming exit of the UK from the EU, it was a surprise to see no large deals from any continental Europe stock exchanges in Q3 2018. Yet, while IPO activity may have been lower than this time last year, investor appetite stood strong as first-day pops and post-IPO performance exceeded expectations.”
- ends -
Notes to Editors
About EY
EY is a global leader in assurance, tax, transaction and advisory services. The insights and quality services we deliver help build trust and confidence in the capital markets and in economies the world over. We develop outstanding leaders who team to deliver on our promises to all of our stakeholders. In so doing, we play a critical role in building a better working world for our people, for our clients and for our communities.
EY refers to the global organization, and may refer to one or more, of the member firms of Ernst & Young Global Limited, each of which is a separate legal entity. Ernst & Young Global Limited, a UK company limited by guarantee, does not provide services to clients. For more information about our organization, please visit ey.com.
This news release has been issued by EYGM Limited, a member of the global EY organization that also does not provide any services to clients.
About EY’s Growth Markets Network
EY’s worldwide Growth Markets Network is dedicated to serving the changing needs of high-growth companies. For more than 30 years, we’ve helped many of the world’s most dynamic and ambitious companies grow into market leaders. Whether working with international, mid-cap companies or early stage, venture backed businesses, our professionals draw upon their extensive experience, insight and global resources to help your business succeed. ey.com/growthmarkets
About EY’s Initial Public Offering Services
EY is a leader in helping companies go public worldwide. With decades of experience, our global network is dedicated to serving market leaders and helping businesses evaluate the pros and cons of an initial public offering (IPO). We demystify the process by offering IPO readiness assessments, IPO preparation, project management and execution services, all of which help prepare you for life in the public spotlight. Our Global IPO Center of Excellence is a virtual hub, which provides access to our IPO knowledge, tools, thought leadership and contacts from around the world in one easy-to-use source.
ey.com/ipo
About the data
The data presented in the Global IPO trends: Q3 2018 report and press release is from Dealogic and EY. Q3 2018 (i.e., July-September) and YTD 2018 (January-September) is based on priced IPOs as of 11 September 2018 and expected IPOs in September. Data is up to 12 September 2018, 6 a.m. UK time. All data contained in this document is sourced to Dealogic and EY unless otherwise noted.


