


EY refers to the global organization, and may refer to one or more, of the member firms of Ernst & Young Global Limited, each of which is a separate legal entity. Ernst & Young Global Limited, a UK company limited by guarantee, does not provide services to clients.
Recent Searches

Outward direct investment was generally stable whilst overseas M&As continued to decrease with pick-up in some regions and sectors. China overall ODI reached US$146.5 billion in 2022, up 0.9% YOY.
In brief
- China overall outward direct investment (ODI) reached US$146.5 billion in 2022, up 0.9% year-on-year (YOY). The non-financial ODI reached US$116.9 billion, up 2.8% YOY. The Belt and Road (B&R) non-financial ODI increased 3.3% YOY to US$21.0 billion1.
- In 2022, the value of announced China overseas mergers and acquisitions (M&As) reached US$28.7 billion, down 52% YOY to a historic low compared to the past years with considerably fewer large-scale deals. There were 507 announced China overseas M&A deals in 2022, down 6% YOY. Deal volumes in some regions and sectors increased as activities picked up compared to the previous year2.
- Newly-signed China overseas engineering, procurement & construction (EPC) projects decreased 2.1% YOY to US$253.1 billion1.
In 2022, the economy of China as well as the world economy have been facing lots of challenges brought with increased geopolitical complexity such as energy crisis and inflation. China experienced the pressure of softer economy indicated by weakened consumption, imports and exports. Based on the latest International Monetary Fund (IMF)3 estimates, the global growth for 2023 is projected to decrease to 2.9% from 3.4% in 2022. A majority of key economies, especially advanced economies, might see further reduction in economic growth this year. China might steadily revive its economy as it optimized pandemic prevention and control. This might be followed by a gradual recovery of cross-border investment by Chinese enterprises though caution is needed in view of geopolitical risks in some areas and the growing macroeconomic uncertainty.
ODI develops steadily as outbound investment in some industries grew relatively quickly
Statistics showed that China overall ODI was US$146.5 billion in 2022, up 0.9% YOY. China non-financial ODI was US$116.9 billion in 2022, up 2.8% YOY. Outbound investment in some industries grew relatively quickly, such as wholesale & retail, manufacturing, as well as leasing and business services, up 19.5%, 17.4% and 5.8% YOY respectively. The B&R non-financial ODI was US$21.0 billion, up 3.3% YOY and representing 17.9% of the total. The investments were made mainly in ASEAN, Pakistan, the United Arab Emirates, Serbia and Bangladesh1.
Figure 1: China overall ODI (US$ billion)
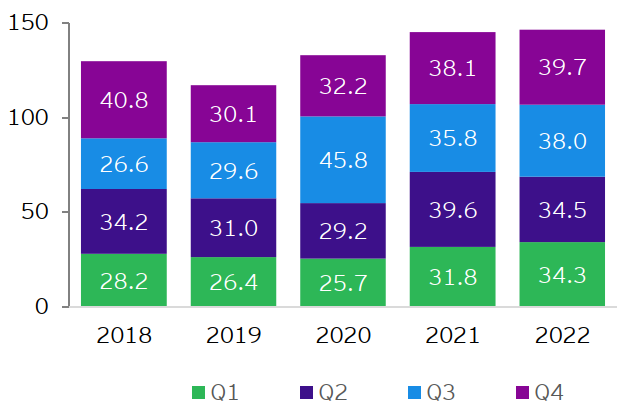
*The round-up statistics in this article may not add to the actual totals.
Sources: Monthly Statistics in Brief, China MOFCOM; Monthly Statistics in Brief, China MOFCOM; State Administration of Foreign Exchange of China
Figure 2: China non-financial ODI along the B&R (US$ billion)
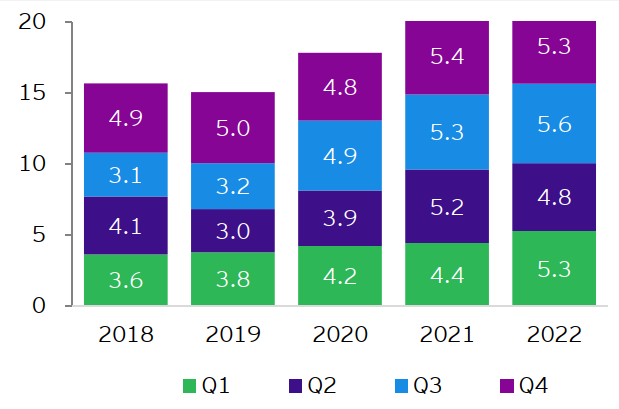
*The round-up statistics in this article may not add to the actual totals.
Sources: Monthly Statistics in Brief, China MOFCOM; State Administration of Foreign Exchange of China
China overseas M&As reached a historic low value in the year however activities in some regions and sectors increased
In 2022, the value of announced China overseas M&As reached US$28.7 billion, down 52% YOY to a historic low. On the one hand, China overseas investment sentiment turned cautious following the impact brought by the global economic dynamics and China’s pandemic policies; on the other hand, the value of more deals was undisclosed affecting the statistical results. There were 507 announced China overseas M&A deals during the year, down 6% YOY. Deal volumes in some regions and sectors increased as activities picked up compared to the previous year.
Figure 3: Value of announced China overseas M&As (US$ billion)
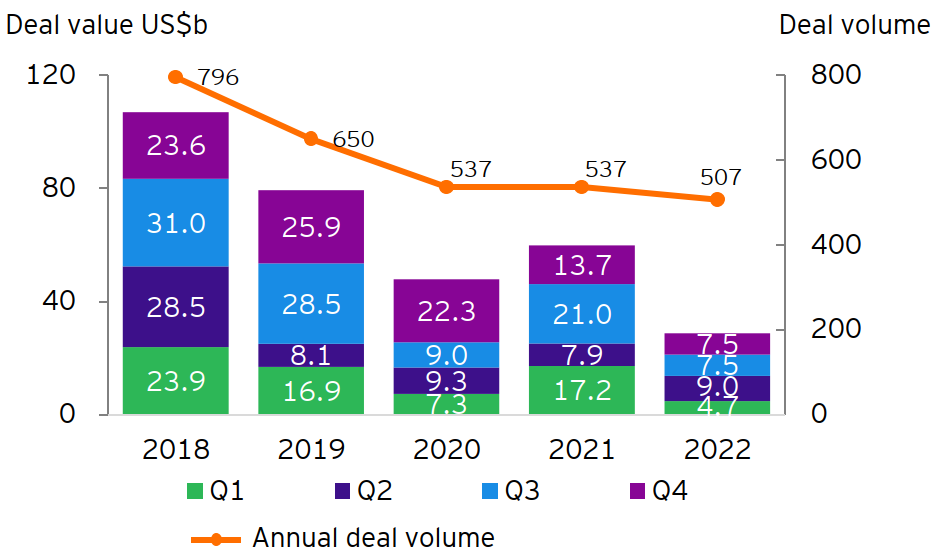
*The round-up statistics in this article may not add to the actual totals.
Sources: Refinitiv; Mergermarket, including data from Hong Kong, Macau and Taiwan, and deals that have been announced but not yet completed, data was downloaded on 4 January 2023; EY analysis
Figure 4: China overseas M&As by sector in 2022 (by deal value, YOY %)
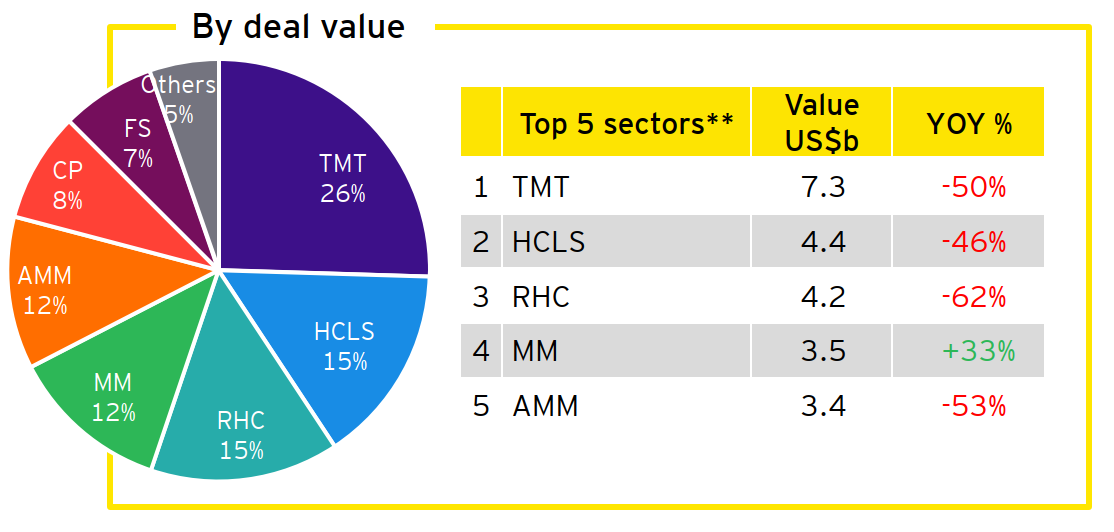
**The health care & life sciences sector is referred as HCLS; real estate, hospitality & construction as RHC; metals & mining as MM; advanced manufacturing & mobility as AMM; consumer products as CP; financial services as FS; power & utilities as PU; oil & gas as OG
Sources: Refinitiv; Mergermarket, including data from Hong Kong, Macau and Taiwan, and deals that have been announced but not yet completed, data was downloaded on 4 January 2023; EY analysis
Figure 5: China overseas M&As by sector in 2022 (by deal volume, YOY %)
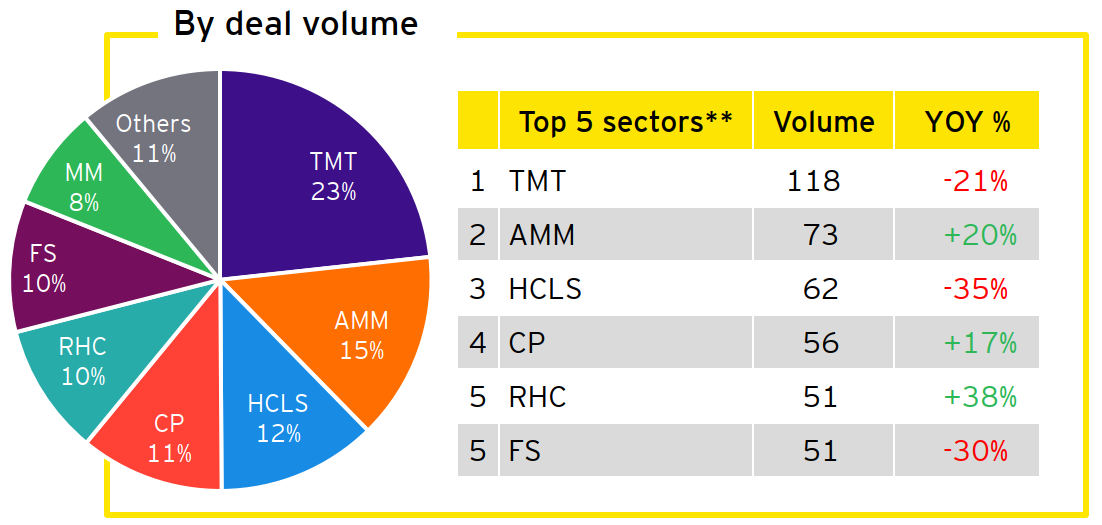
**The health care & life sciences sector is referred as HCLS; real estate, hospitality & construction as RHC; metals & mining as MM; advanced manufacturing & mobility as AMM; consumer products as CP; financial services as FS; power & utilities as PU; oil & gas as OG
Sources: Refinitiv; Mergermarket, including data from Hong Kong, Macau and Taiwan, and deals that have been announced but not yet completed, data was downloaded on 4 January 2023; EY analysis
Figure 6: Regional distribution of announced China overseas M&As by sector in 2022 (by deal value)
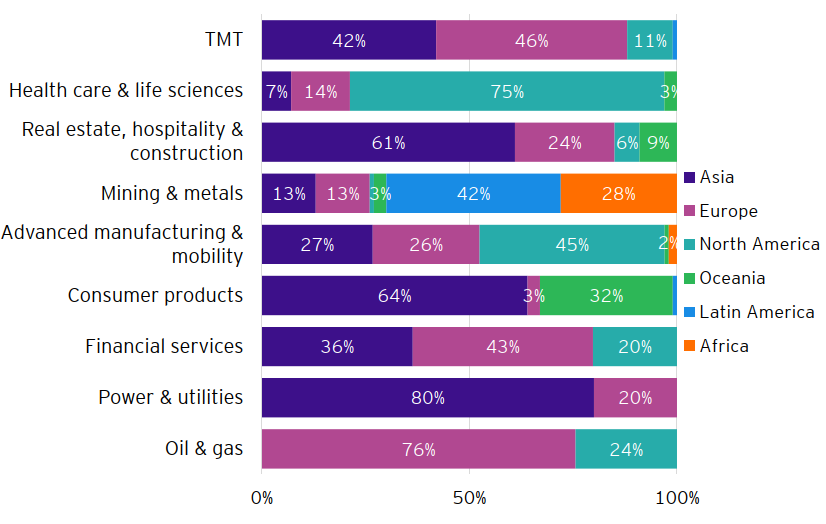
Sources: Refinitiv; Mergermarket, including data from Hong Kong, Macau and Taiwan, and deals that have been announced but not yet completed, data was downloaded on 4 January 2023; EY analysis
Figure 7: Deal value and volume of China overseas M&As by continent in 2022
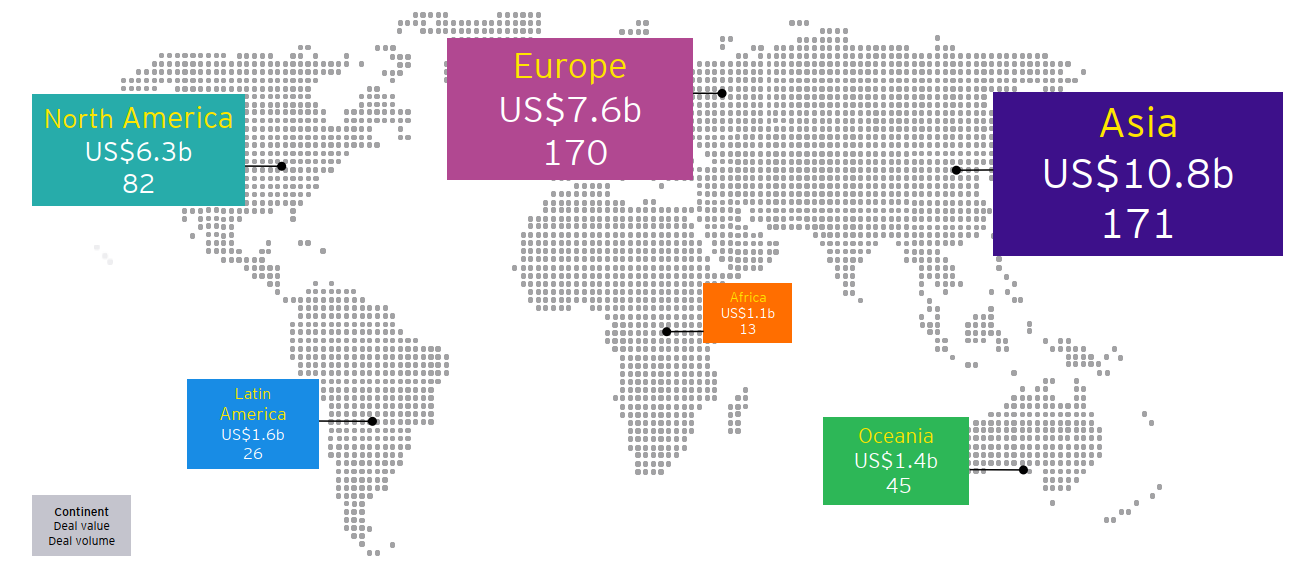
Figure 8: Top 10 destinations of China overseas M&As in 2022 (By deal value: US$ billion)
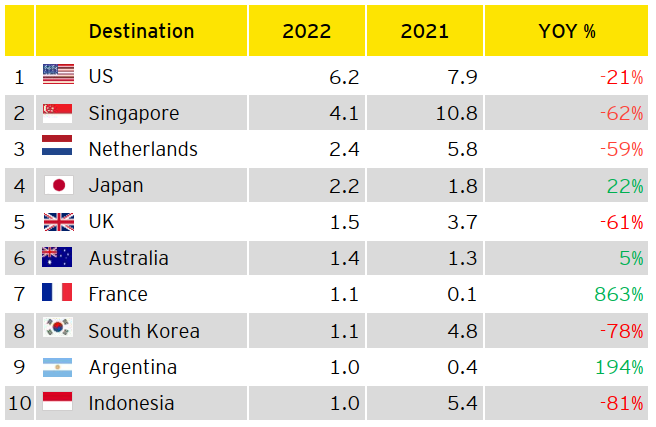
Refinitiv; Mergermarket, including data from Hong Kong, Macau and Taiwan, and deals that have been announced but not yet completed, data was downloaded on 4 January 2023; EY analysis
Figure 9: Top 10 destinations of China overseas M&As in 2022 (By deal volume)
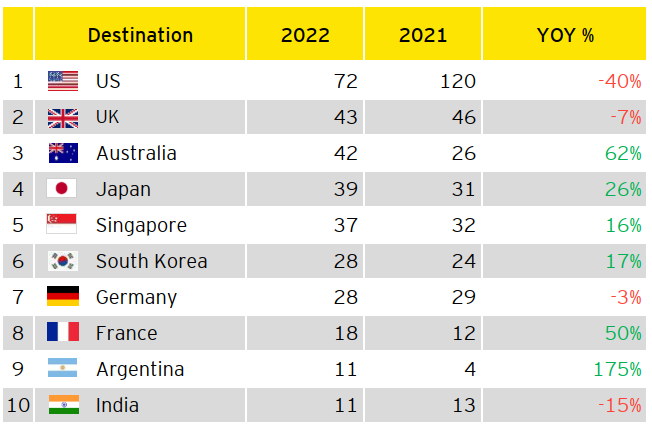
Refinitiv; Mergermarket, including data from Hong Kong, Macau and Taiwan, and deals that have been announced but not yet completed, data was downloaded on 4 January 2023; EY analysis
Steady development of overseas EPC projects helps boost growth of destination countries
Newly-signed China overseas EPC projects decreased 2.1% YOY to US$253.1 billion in 2022. In the B&R countries and regions, Chinese enterprises newly-signed EPC projects of US$129.6 billion, with a decrease of 3% YOY, which represented 51.2% of the total during the year1. Although 2022 was full of challenges, more new overseas projects were signed by Chinese enterprises, such as the tunnelling projects in Neom and Madinah, Saudi Arabia in the transport infrastructure, in addition to the Standard Gauge Central Railway project in Tanzania. In the energy and power area, there were the national natural gas pipeline project in Argentina, the power transmission and transformation project in Angola, the largest wind power station project in Uzbekistan, the photovoltaic power plant project in Saudi Arabia, as well as other major projects including the social housing in Saudi Arabia5.
In 2022, the completed turnover of Chinese enterprises’ foreign contracting projects was US$155.0 billion, which was about the same compared to that of last year, while the completed turnover in the B&R countries and regions was US$84.9 billion, down 5% YOY, accounting for 54.8% of the total during the year1. In 2022, Chinese EPC service providers overcame numerous obstacles to implement an assortment of landmark projects, such as the trial operation of ASEAN’s first high-speed railway, the official launch of Cambodia’s first expressway, the completion of the southern portion of South Asia’s first underwater tunnel (namely the Kanapuri River Bottom Tunnel in Bangladesh), the launch of the Pelješac Bridge in Croatia and the first Chinese standard construction highway in Cameroon, as well as the smooth delivery of the main stadium project of the Qatar World Cup5. These completed projects showcased technical and competitive advantages of Chinese EPC enterprises and also helped drive economic development of the destination countries and provide benefits to their peoples. The Chinese EPC providers have accumulated know-how over years for a comparative advantage in the international engineering market. With reference to the latest international contractor rankings released by the Engineering News Record, seven Chinese enterprises were listed on the top 20 in 2022, adding one enterprise compared to 2021. In total, 79 Chinese enterprises were among the top 250 international contractors list, accounting for more than 30% of the total⁶. Amid the downward pressure in the global economic outlook in 2023, infrastructure projects may drive investment and provide economic momentum in destination countries. Chinese construction players are likely to continue to expand their international footprints and enter the fields of intelligent digitalization and low-carbon green transition with more benchmarking projects in the future.
Figure 10: Value of newly signed China overseas EPC contracts (US$ billion)
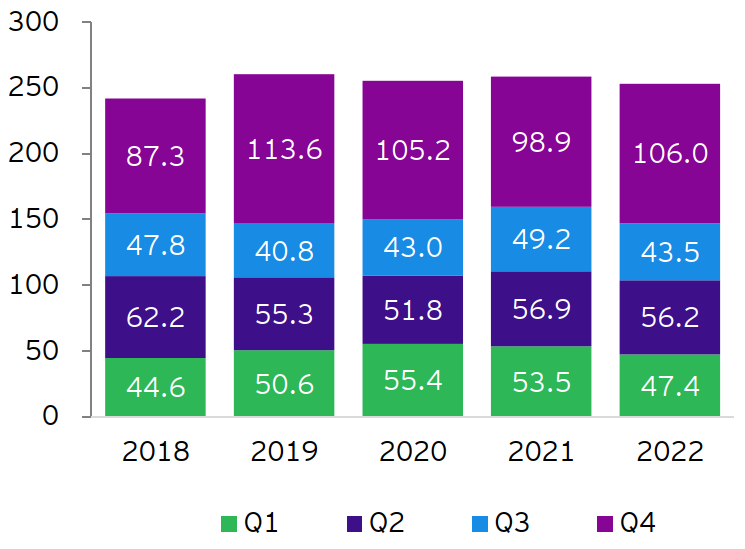
*The round-up statistics in this article may not add to the actual totals.
Source: Monthly Statistics in Brief, China MOFCOM
Figure 11: Completed turnover of China overseas EPC contracts (US$ billion)
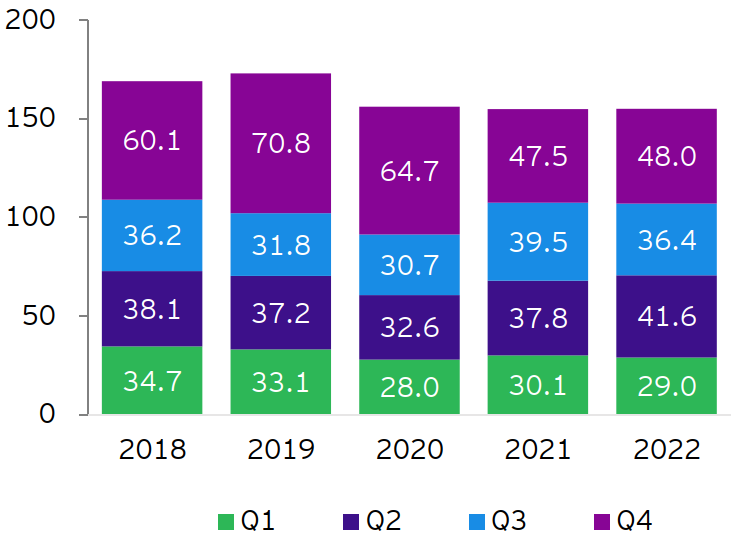
*The round-up statistics in this article may not add to the actual totals.
Source: Monthly Statistics in Brief, China MOFCOM
Summary
EY releases the Overview of China outbound investment of 2022. The overview shows that China ODI was generally stable with an increase of 0.9% YOY and outbound investment in some industries grew relatively quickly. Nonetheless, the outbound M&A activities continued to slow recording a value drop of 52% YOY, and a volume drop of 6% YOY. Asia remained the top overseas M&A destination during the year.
Related articles
Overview of China outbound investment of the first three quarters of 2022
Outward direct investment generally stable with slower overseas M&A activities. China overall ODI reached US$106.8 billion in the first three quarters of 2022, down 0.3% YOY and the Q3 figure increased 10% from that of Q2.
Overview of China outbound investment of 2021
Higher investment growth was observed in Belt and Road region; health care and life sciences sector in Europe and North America was popular. China’s overall outward direct investment (ODI) maintained its steady development in 2021 with a year-on-year (YOY) increase of 9.2% to US$145.2 billion.
Chinese companies in the US remain cautiously positive as opportunity and challenge co-exist
Chinese companies in the US remain cautiously positive as opportunity and challenge co-exist, according to 2021 Annual Business Survey Report on Chinese Enterprises in the US.