


EY refers to the global organization, and may refer to one or more, of the member firms of Ernst & Young Global Limited, each of which is a separate legal entity. Ernst & Young Global Limited, a UK company limited by guarantee, does not provide services to clients.
Recent Searches

Non-financial ODI experienced rapid growth, while China overseas M&A value achieved growth with notable increase in large transactions. China's overall ODI amounted to US$147.9 billion, up 0.9% YOY.
In brief
- China's overall outward direct investment (ODI) reached US$147.9 billion, marking a 0.9% year-on-year (YOY) increase. Non-financial ODI reached US$130.1 billion, up 11.4% YOY. Non-financial ODI in Belt and Road (B&R) partner countries totaled US$31.8 billion, up 22.6%¹.
- Chinese enterprises announced a 20.3% YOY increase in overseas merger and acquisition (M&A) value, reaching US$39.8 billion, marking three consecutive quarters of quarter-over-quarter (QOQ) growth. Despite a decrease in number of deals to 457 (down 16.3% YOY), the presence of large transactions exceeding US$500 million notably rose. M&A activity in B&R partner countries surged by 32.4% YOY, outpacing the overall growth rate².
- Newly-signed China overseas engineering, procurement and construction (EPC) projects totaled US$264.5 billion, making a five-year high, up 4.5% YOY. The completed turnover reached US$160.9 billion, indicating a 3.8% YOY growth, with B&R partner countries contributing over 80% and surpassed the overall growth rate¹.
In 2023, despite the complex global political and economic landscape, China’s Gross Domestic Product (GDP) grew by 5.2% YOY³, meeting its set targets. Throughout the year, China’s economic external circulation developed steadily and the commitment to multilateralism continued. The successful hosting of the first China-Central Asia Summit and the decade milestone of the Belt and Road Initiative (BRI), including the unveiling of eight Action Plans for future development, hold profound significance. The expansion of the Shanghai Cooperation Organization and BRICS further propelled win-win cooperation between China and developing countries. At present, Chinese enterprises have entered a new phase of global expansion, with China’s technology and brands accelerating expanding their presence overseas and delving into fresh growth opportunities. Simultaneously, China's industrial transformation aligns with global trends such as the digitalization, green economy, and reshaping of industrial value chain. Looking ahead to 2024, as the world enters a “super election year”, the global geopolitical landscape will face more challenges. However, China remains committed to its high-level policy of opening-up. Fueled by the strong drive for development among enterprises, it is anticipated that “going global” will continue to be a key growth strategy for many Chinese companies.
Non-financial ODI achieved rapid growth, with B&R partner countries surpassing the overall growth rate¹
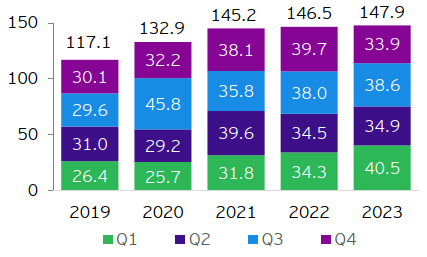
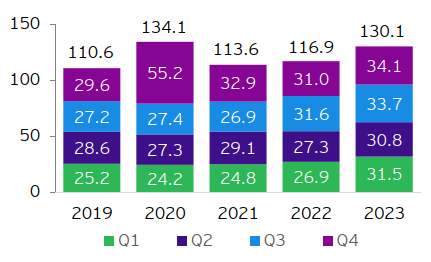
In 2023, China's overall ODI reached US$147.9 billion, up 0.9% YOY (in terms of RMB1,041.9 billion, up 5.7% YOY). Non-financial ODI amounted to US$130.1 billion, up 11.4% YOY (RMB917 billion, up 16.7% YOY). Specifically, non-financial ODI in B&R partner countries reached US$31.8 billion, up 22.6% (RMB224.1 billion, up 28.4% YOY), accounting for nearly a quarter of the total. According to State Administration of Foreign Exchange of China, RMB has depreciated by 4.55% in 2023 compared to the previous year⁴, leading to a relatively lower growth rate of ODI denominated in US dollars.
Figure 1: China overall ODI (US$ billion)
Note: The round-up statistics in this article may not add to the actual totals.
Source: Monthly Statistics in Brief, China MOFCOM
Figure 2: China’s non-financial ODI (US$ billion)
Note: The round-up statistics in this article may not add to the actual totals.
Source: Monthly Statistics in Brief, China MOFCOM
China overseas M&A values achieved consecutive QOQ growth for three quarters, significant increase in number of large transactions compared to the previous year²
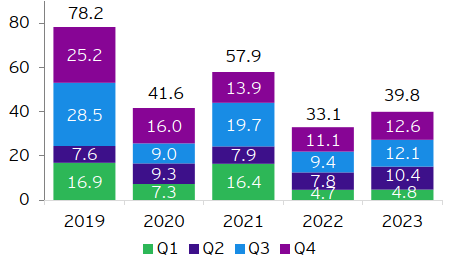
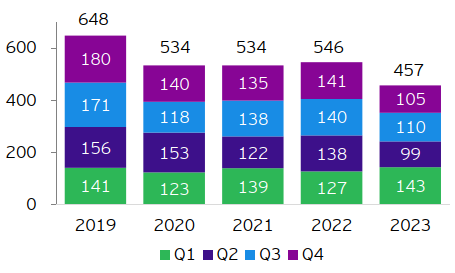
In 2023, China announced a total overseas M&A value of US$39.8 billion, up 20.3% YOY and achieving consecutive QOQ growth for three quarters. Despite a decrease in deal volume to 457, down by 16.3% YOY, the year witnessed a substantial increase in large transactions. Specifically, there were 21 deals exceeding US$500 million, an increase of 13 deals compared to 2022. China’s M&A value in B&R partner countries reached US$17.3 billion, showing a YOY growth of 32.4%, surpassing the overall growth rate. Although deal volume decreased 2.6% YOY to 185, it was significantly smaller than the overall decline. Moreover, the proportion of M&A value in B&R partner countries increased by four percentage points compared to the same period last year, reaching 44%.
Figure 3: Value of China announced overseas M&As (US$ billion)
Note: The round-up statistics in this article may not add to the actual totals.
Sources: Refinitiv, Mergermarket, including data from Hong Kong, Macau, and Taiwan, and deals that have been announced but not yet completed, data was downloaded on 8 January 2024; EY analysis
Figure 4: Volume of China announced overseas M&As (Number of deals)
Note: The round-up statistics in this article may not add to the actual totals.
Sources: Refinitiv, Mergermarket, including data from Hong Kong, Macau, and Taiwan, and deals that have been announced but not yet completed, data was downloaded on 8 January 2024; EY analysis
Figure 5: Announced China overseas M&As by sector (By deal value)
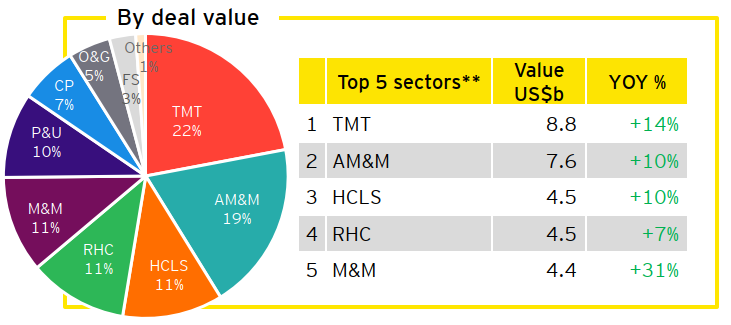
**AM&M refers to advanced manufacturing & mobility; HCLS refers to health care & life sciences; RHC refers to real estate, hospitality & construction; M&M refers to mining & metals; P&U refers to power & utilities; CP refers to consumer products; FS refers to financial services.
Sources: Refinitiv, Mergermarket, including data from Hong Kong, Macau, and Taiwan, and deals that have been announced but not yet completed, data was downloaded on 8 January 2024; EY analysis
Figure 6: Announced China overseas M&As by sector (By deal volume)
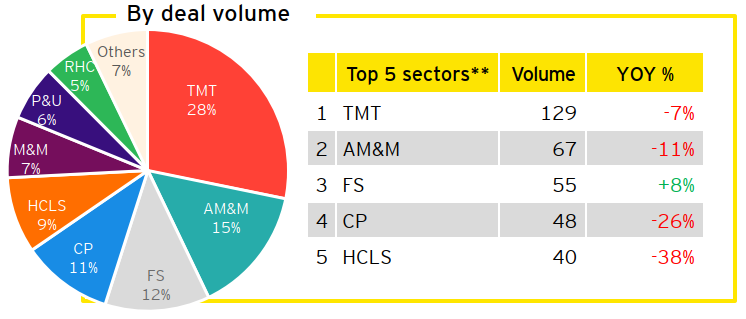
**AM&M refers to advanced manufacturing & mobility; HCLS refers to health care & life sciences; RHC refers to real estate, hospitality & construction; M&M refers to mining & metals; P&U refers to power & utilities; CP refers to consumer products; FS refers to financial services.
Sources: Refinitiv, Mergermarket, including data from Hong Kong, Macau, and Taiwan, and deals that have been announced but not yet completed, data was downloaded on 8 January 2024; EY analysis
Figure 7: Regional distribution of announced China overseas M&As by sector (By deal value)
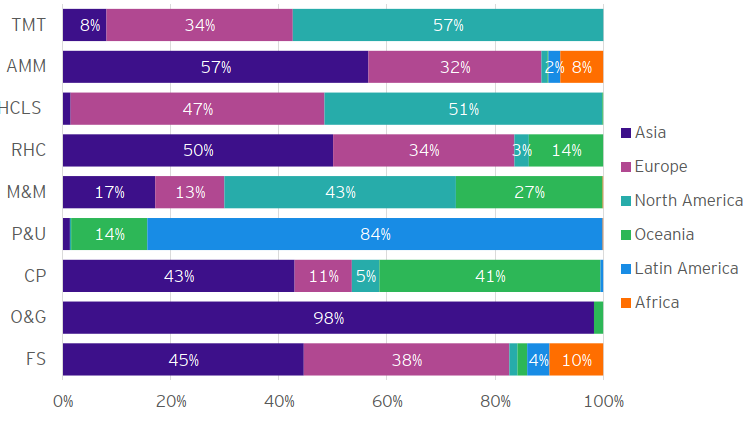
Sources: Refinitiv, Mergermarket, including data from Hong Kong, Macau, and Taiwan, and deals that have been announced but not yet completed, data was downloaded on 8 January 2024; EY analysis
Figure 8: Deal value and volume of China overseas M&As by continent
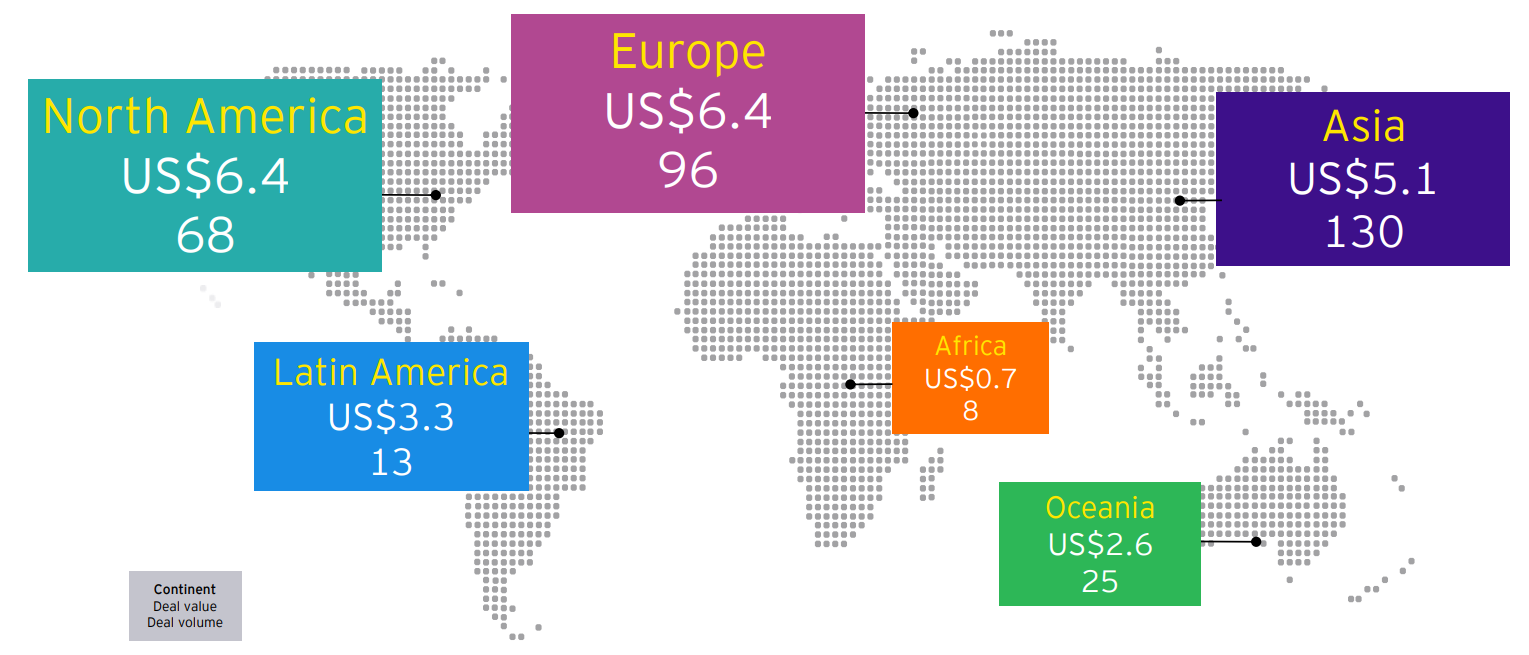
Sources: Refinitiv, Mergermarket, including data from Hong Kong, Macau, and Taiwan, and deals that have been announced but not yet completed, data was downloaded on 8 January 2024; EY analysis
Figure 9: Top 10 destinations of China overseas M&As (By deal value, US$ billion)
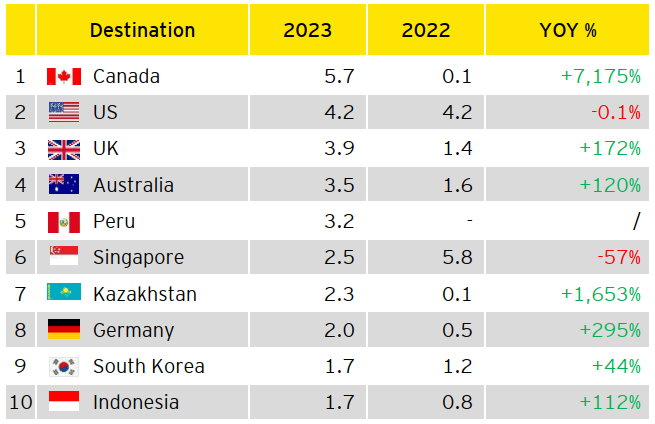
Sources: Refinitiv, Mergermarket, including data from Hong Kong, Macau, and Taiwan, and deals that have been announced but not yet completed, data was downloaded on 8 January 2024; EY analysis
Figure 10: Top 10 destinations of China overseas M&As (By deal volume, number of deals)
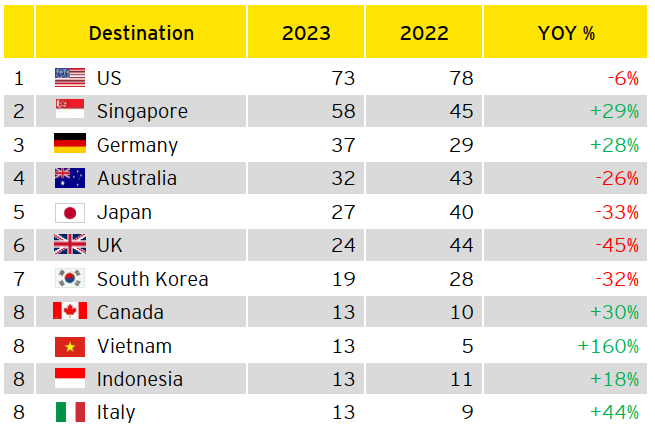
Sources: Refinitiv, Mergermarket, including data from Hong Kong, Macau, and Taiwan, and deals that have been announced but not yet completed, data was downloaded on 8 January 2024; EY analysis
The value of newly-signed EPC projects slightly decreased YOY, with over 80% attributed to B&R partner countries¹
In 2023, the value of newly-signed China overseas EPC projects reached US$264.5 billion, up 4.5% YOY. New contracts in B&R partner countries totaled US$227.2 billion, up 5.7% YOY, comprising 86% of the total.
The completed turnover of overseas EPC projects by Chinese enterprises was US$160.9 billion, up 3.8% YOY. The completed turnover in B&R partner countries reached US$132.1 billion, up 4.8% YOY, comprising 82% of the total.
Figure 11: Value of newly-signed China overseas EPC contracts (US$ billion)
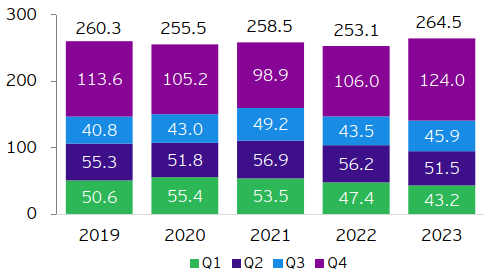
Note: The round-up statistics in this article may not add to the actual totals.
Source: Monthly Statistics in Brief, China MOFCOM
Figure 12: Value of completed turnover of China overseas EPC contracts (US$ billion)
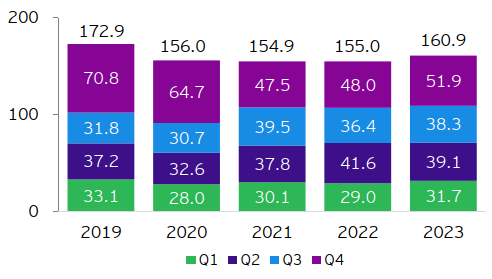
Note: The round-up statistics in this article may not add to the actual totals.
Source: Monthly Statistics in Brief, China MOFCOM
Summary
EY Greater China region released the Overview of China outbound investment of 2023. The report highlights a 0.9% YOY growth in China’s overall ODI, reaching US$147.9 billion; non-financial ODI increased by 11.4%, showing rapid growth, with B&R partner countries outpacing the overall increase. Additionally, Chinese enterprises announced a total overseas M&A value of US$39.8 billion, growing by 20.3% YOY. Notably, this marks three consecutive quarters of QOQ growth and accompanied by a significant increase in number of large transactions compared to the preceding year.
Related articles
Overview of China outbound investment of the first three quarters of 2023
China's ODI sustained growth, while overseas M&A value rebounded amid volume contraction, the market recovery remains uncertain. China's overall ODI amounted to US$114 billion, up 6.7% YOY.
Empowering high-quality development of the Belt and Road
These reports, viewed through the lenses of sustainability and digitalization, summarize the progress, achievements and trends in jointly building the Belt and Road (B&R) since 2013. They also showcase cases and experiences of some Chinese enterprises participating in B&R construction, offering valuable insights to encourage more Chinese and multinational companies to participate in the high-quality development of the BRI.
Overview of China outbound investment of 2022
Outward direct investment was generally stable whilst overseas M&As continued to decrease with pick-up in some regions and sectors. China overall ODI reached US$146.5 billion in 2022, up 0.9% YOY.