


EY refers to the global organization, and may refer to one or more, of the member firms of Ernst & Young Global Limited, each of which is a separate legal entity. Ernst & Young Global Limited, a UK company limited by guarantee, does not provide services to clients.
Recent Searches

China outward direct investment made a positive start, while overseas M&A activities remain sluggish. China overall ODI was US$40.5 billion in the Q1 2023, representing a significant increase of 18% YOY.
In brief
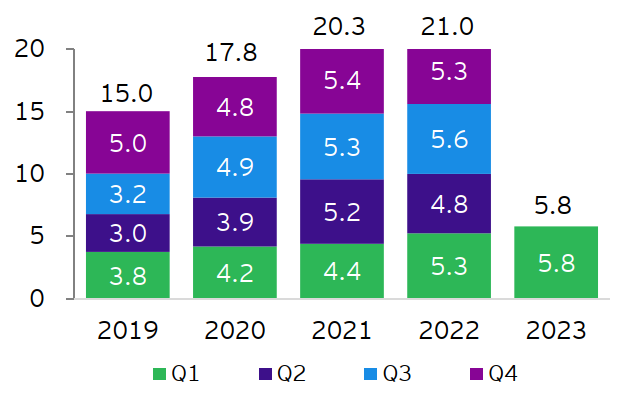
- China overall outward direct investment (ODI) was US$40.5 billion in the first quarter of (Q1) 2023, representing a significant year-on-year (YOY) increase of 18%. The non-financial ODI was US$31.5 billion, up 17.2% YOY. The Belt and Road (B&R) non-financial ODI increased 9.5% YOY to US$5.8 billion1.
- The value of announced China overseas mergers and acquisitions (M&As) was only US$3.5 billion, down 26% YOY to a recent quarterly low. The number of announced deals decreased by 4% to 1162.
- Newly-signed China overseas engineering, procurement & construction (EPC) projects decreased 9% YOY to US$43.2 billion. However, the proportion of newly-signed B&R EPC projects increased considerably, up 7.2 percentage points YOY. Completed turnover of China overseas EPC projects totaled US$31.7 billion, up 9.2% YOY1.
Amid the volatile international financial market in Q1 2023, the global economy was projected to increase 2.8%3. Inflation pressure appeared to have eased from previous heights among advanced economies. Yet, the gap from the target level is still there and, therefore, interest rates among key economies might be kept relatively higher in the near term and the global economic downward pressure might continue. In addition, the fragmented impact of geopolitical risks on investment and economic output is expanding, posing challenges for Chinese enterprises going abroad. On the other hand, China’s economy has shown signs of recovery this year, with consumption growth turning positive, foreign trade improving month by month, and ODI recording a significant YOY growth in Q1. With the steady economic development of China in Q1 and the promotion of high-level opening-up, the momentum of China outbound investment is expected to further increase. Moreover, the high-level interactions between China and many countries in the early 2023 may also provide increased direction and opportunities for Chinese enterprises seeking overseas development.
ODI made a positive start, recording double-digit increase
Statistics shows that in Q1 2023, China overall ODI reached US$40.5 billion, up 18% YOY. China non-financial ODI was US$31.5 billion during the period, up 17.2% YOY. Some industries saw faster growth in ODI, with investments in wholesale & retail industry and transportation, warehousing and postal services increasing by 31.4% and 24.4%, respectively. The B&R non-financial ODI was US$5.8 billion, up 9.5% YOY and representing 18.3% of the total for the same period, mainly invested in countries and regions such as ASEAN, Serbia, the United Arab Emirates and Kazakhstan¹.
Figure 1: China overall ODI (US$ billion)
Note: Due to rounding, the total may not be equal to the sum of individual quarters.
Sources: Monthly Statistics in Brief, China MOFCOM
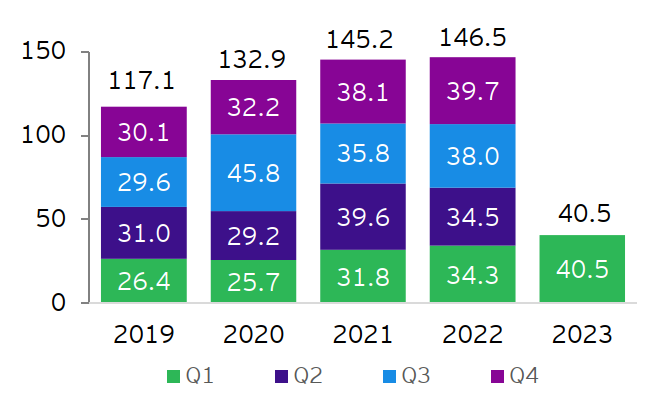
Figure 2: China non-financial ODI along the B&R (US$ billion)
Note: Due to rounding, the total may not be equal to the sum of individual quarters.
Sources: Monthly Statistics in Brief, China MOFCOM
China overseas M&As continued to decrease with advanced manufacturing & mobility as the most popular sector
In Q1 2023, the value of announced China overseas M&As was only US$3.5 billion, down 26% YOY to a recent quarterly low. The number of announced deals decreased by 4% to 116.
Figure 3: Value of announced China overseas M&As (US$ billion)
Note: Due to rounding, the total may not be equal to the sum of individual quarters.
Sources: Refinitiv; Mergermarket, including data from Hong Kong, Macau and Taiwan, and deals that have been announced but not yet completed, data was downloaded on 3 April 2023; EY analysis
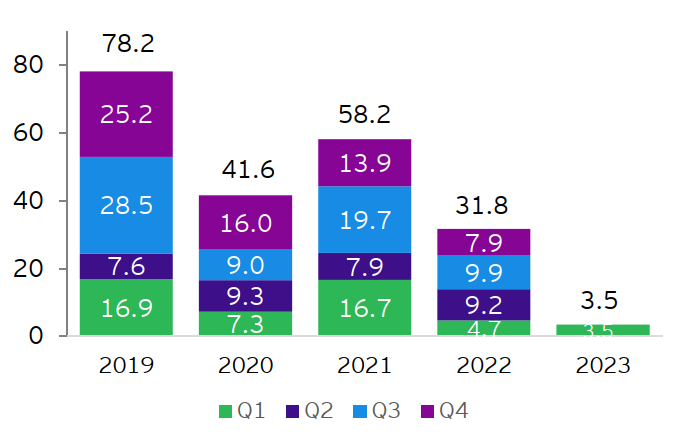
Figure 4: Volume of announced China overseas M&As
Note: Due to rounding, the total may not be equal to the sum of individual quarters.
Sources: Refinitiv; Mergermarket, including data from Hong Kong, Macau and Taiwan, and deals that have been announced but not yet completed, data was downloaded on 3 April 2023; EY analysis
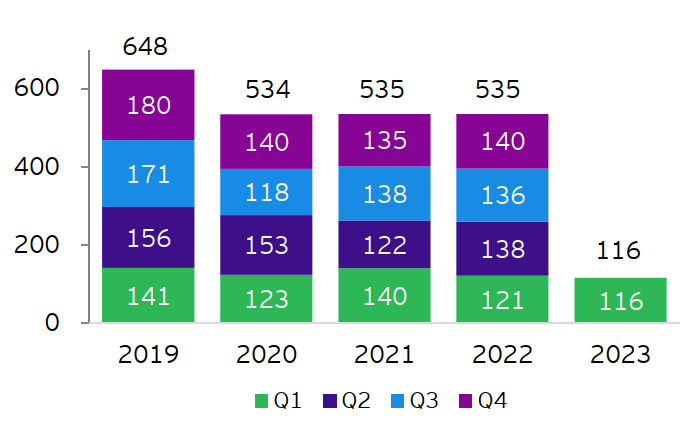
Figure 5: Announced China overseas M&As by sector** in Q1 2023 (by deal value)
**AMM refers to advanced manufacturing & mobility; RHC refers to real estate, hospitality & construction; HCLS refers to health care & life sciences; FS refers to financial services; CP refers to consumer products.
Sources: Refinitiv; Mergermarket, including data from Hong Kong, Macau and Taiwan, and deals that have been announced but not yet completed, data was downloaded on 3 April 2023; EY analysis
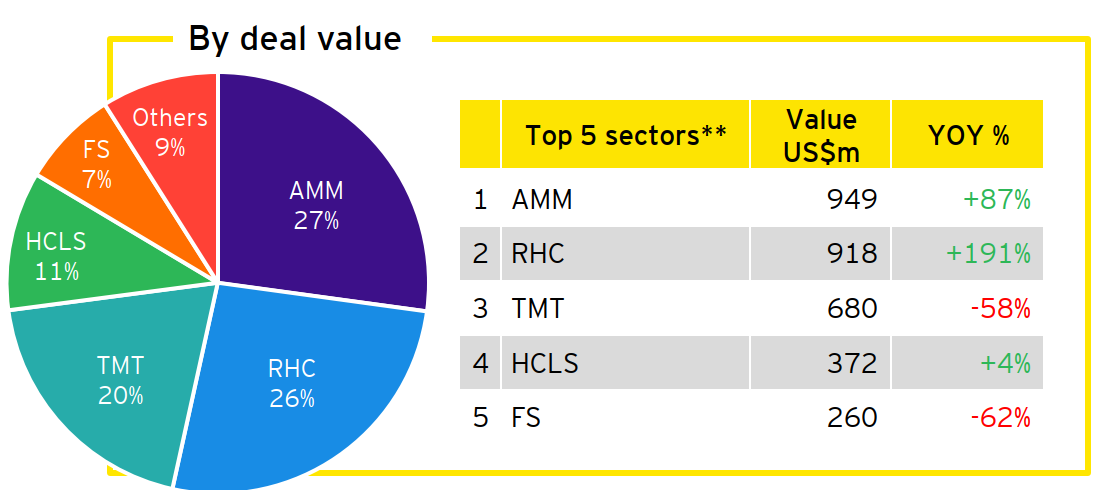
Figure 6: Announced China overseas M&As by sector** in Q1 2023 (by deal volume)
**AMM refers to advanced manufacturing & mobility; RHC refers to real estate, hospitality & construction; HCLS refers to health care & life sciences; FS refers to financial services; CP refers to consumer products.
Sources: Refinitiv; Mergermarket, including data from Hong Kong, Macau and Taiwan, and deals that have been announced but not yet completed, data was downloaded on 3 April 2023; EY analysis
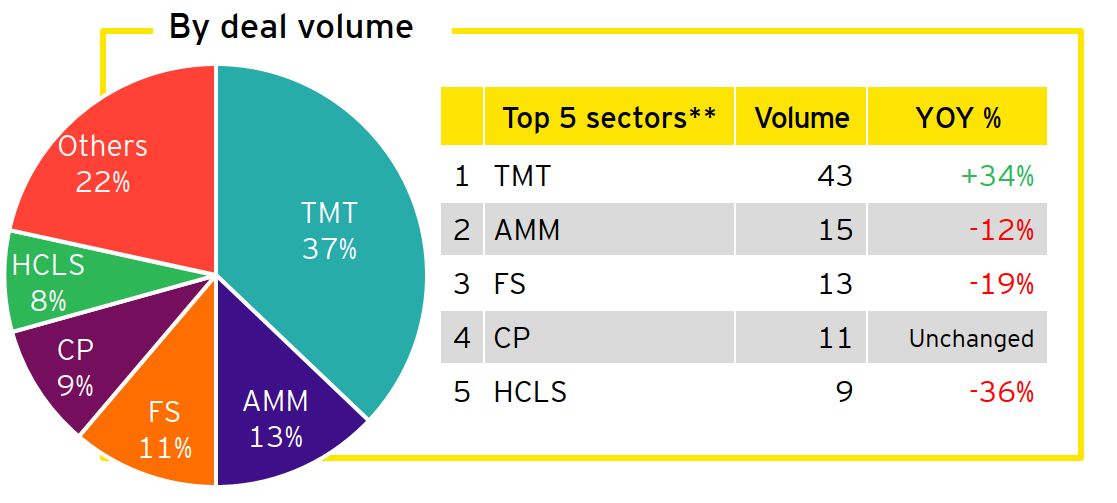
Figure 7: Deal value and volume of China overseas M&As by continent in Q1 2023
Sources: Refinitiv; Mergermarket, including data from Hong Kong, Macau and Taiwan, and deals that have been announced but not yet completed, data was downloaded on 3 April 2023; EY analysis
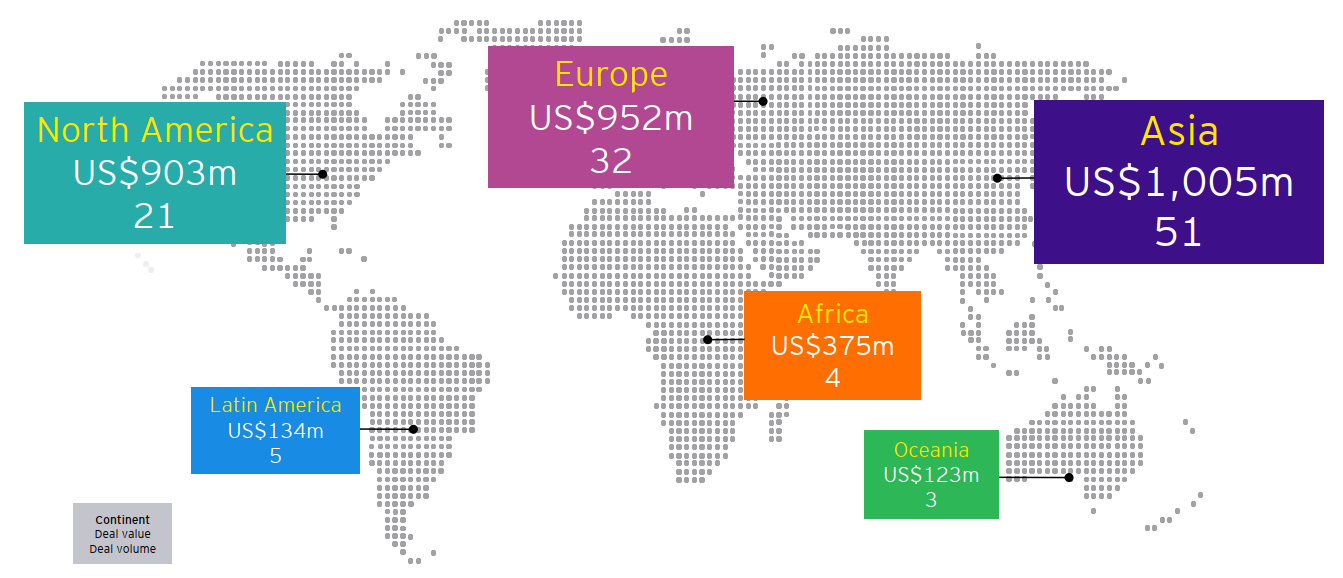
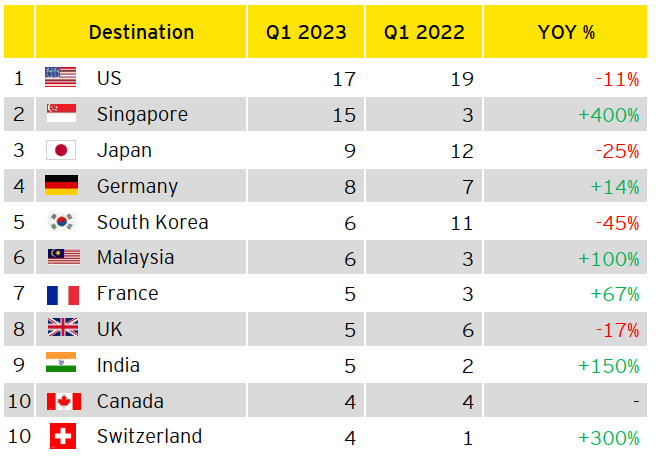
Figure 8: Top 10 destinations of China overseas M&As in Q1 2023 (By deal value: US$ million)
Sources: Refinitiv; Mergermarket, including data from Hong Kong, Macau and Taiwan, and deals that have been announced but not yet completed, data was downloaded on 3 April 2023; EY analysis
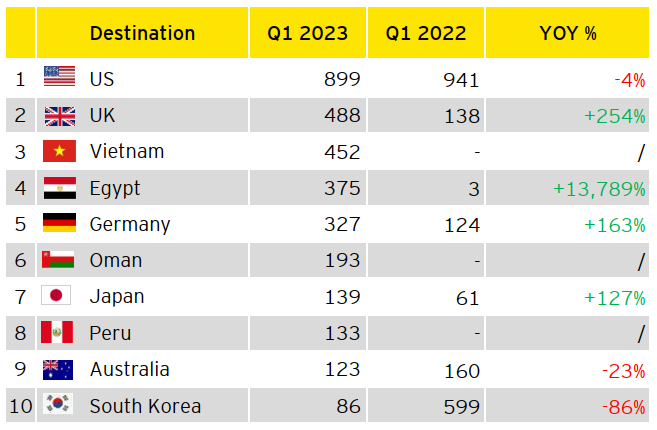
Figure 9: Top 10 destinations of China overseas M&As in Q1 2023 (By deal volume)
Sources: Refinitiv; Mergermarket, including data from Hong Kong, Macau and Taiwan, and deals that have been announced but not yet completed, data was downloaded on 3 April 2023; EY analysis
Turnover of overseas EPC projects increased relatively quickly and percentage of newly-signed B&R projects rose considerably
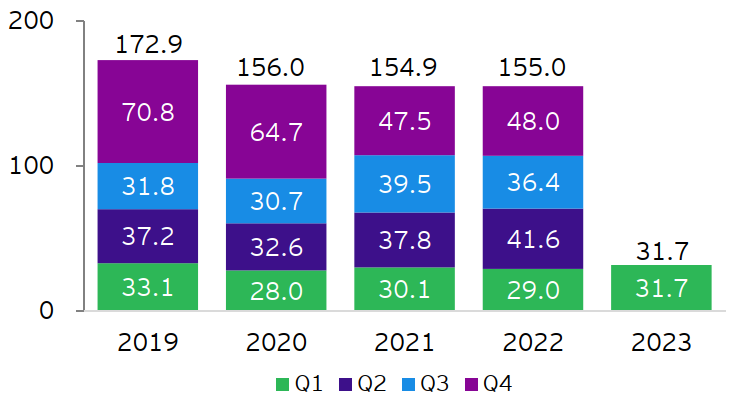
In Q1 2023, the total amount of newly-signed China overseas EPC projects decreased 9% YOY to US$43.2 billion. However, the amount in the B&R countries and regions increased 3.7% YOY to US$25.5 billion, which represented 59.2% of the total during the period, up 7.2 percentage points YOY. The value of completed turnover of Chinese overseas EPC projects was US$31.7 billion, up 9.2% YOY, while the value in the B&R countries and regions was US$17 billion, up 6.5% YOY, accounting for 53.7% of the total1. Examples of new mega-scale projects in this quarter include: 1) an investment agreement signed for solar photovoltaic power production in Uzbekistan with an investment of about US$2 billion; 2) an urban railway project in the Democratic Republic of the Congo (Congo-Kinshasa) worth about US$970 million; 3) a seawater desalination project and a camp project in Saudi Arabia with a combined contract value of about US$650 million; 4) a contract signed for building a cement production line in Nigeria worth about US$580 million4.
Figure 10: Value of newly-signed China overseas EPC contracts (US$ billion)
Note: Due to rounding, the total may not be equal to the sum of individual quarters.
Source: Monthly Statistics in Brief, China MOFCOM
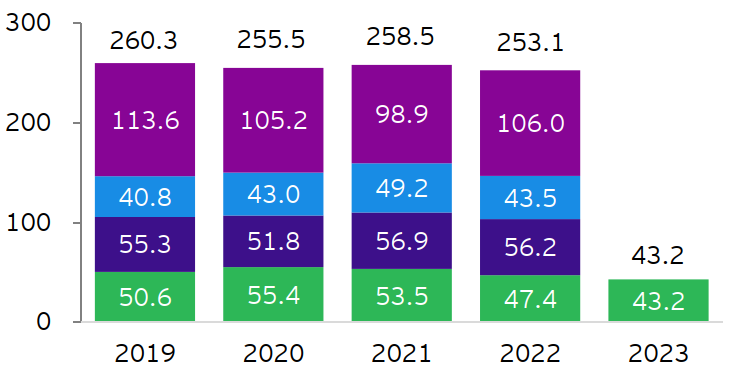
Figure 11: Value of completed turnover of China overseas EPC contracts (US$ billion)
Note: Due to rounding, the total may not be equal to the sum of individual quarters.
Source: Monthly Statistics in Brief, China MOFCOM
Summary
EY Greater China region releases the Overview of China outbound investment of Q1 2023. The report shows that China overall ODI remarkably increased 18% YOY to US$40.5 billion in Q1 2023. However, the announced China overseas M&A activities continued to be sluggish, with announced deal value reaching a recent quarterly low of US$3.5 billion, down 26% YOY. Asia remains the most popular destination for overseas M&As.
Related articles
Overview of China outbound investment of 2023
Non-financial ODI experienced rapid growth, while China overseas M&A value achieved growth with notable increase in large transactions. China's overall ODI amounted to US$147.9 billion, up 0.9% YOY.
Empowering high-quality development of the Belt and Road
These reports, viewed through the lenses of sustainability and digitalization, summarize the progress, achievements and trends in jointly building the Belt and Road (B&R) since 2013. They also showcase cases and experiences of some Chinese enterprises participating in B&R construction, offering valuable insights to encourage more Chinese and multinational companies to participate in the high-quality development of the BRI.
Overview of China outbound investment of 2022
Outward direct investment was generally stable whilst overseas M&As continued to decrease with pick-up in some regions and sectors. China overall ODI reached US$146.5 billion in 2022, up 0.9% YOY.