7 minute read 24 Mar 2023
US$5 trillion economy

How the states can help India achieve the US$5 trillion target by FY28

By D. K. Srivastava

EY India Chief Policy Advisor

A noted economist, D.K. Srivastava is an Honorary Professor at Madras School of Economics and Member of the Advisory Council to the 15th Finance Commission.

7 minute read 24 Mar 2023
Related topics Tax COVID-19

Show resources

States with the highest GSDP include Maharashtra, Tamil Nadu, Uttar Pradesh, Gujarat, and Karnataka.

In brief

  • One of the major milestones that India is looking to achieve is to become a US$5 trillion economy by FY28.
  • Combined GSDP of India’s top five states is likely to reach US$2.6 trillion by FY28, requiring the contribution of some more states to achieve the US$5 trillion target.
  • In PPP terms, each of the top five states are projected to have a size larger than $1 trillion in FY24. 

Two international organizations namely, OECD and CEPR recently undertook studies that examine India’s long-term growth prospects in a global context. EY India, in a report titled ‘India@100: realizing the potential of a US$26 trillion economy1 released at the World Economic Forum on 19 January 2023, has also examined India’s GDP growth prospects, highlighting key growth enablers and potential challenges. A near-term threshold for India is to cross the benchmark of US$5 trillion in market exchange rate terms. One way to look at India’s growth is to assess the contribution made by states to achieve this benchmark.

India’s top five states: size of the economies

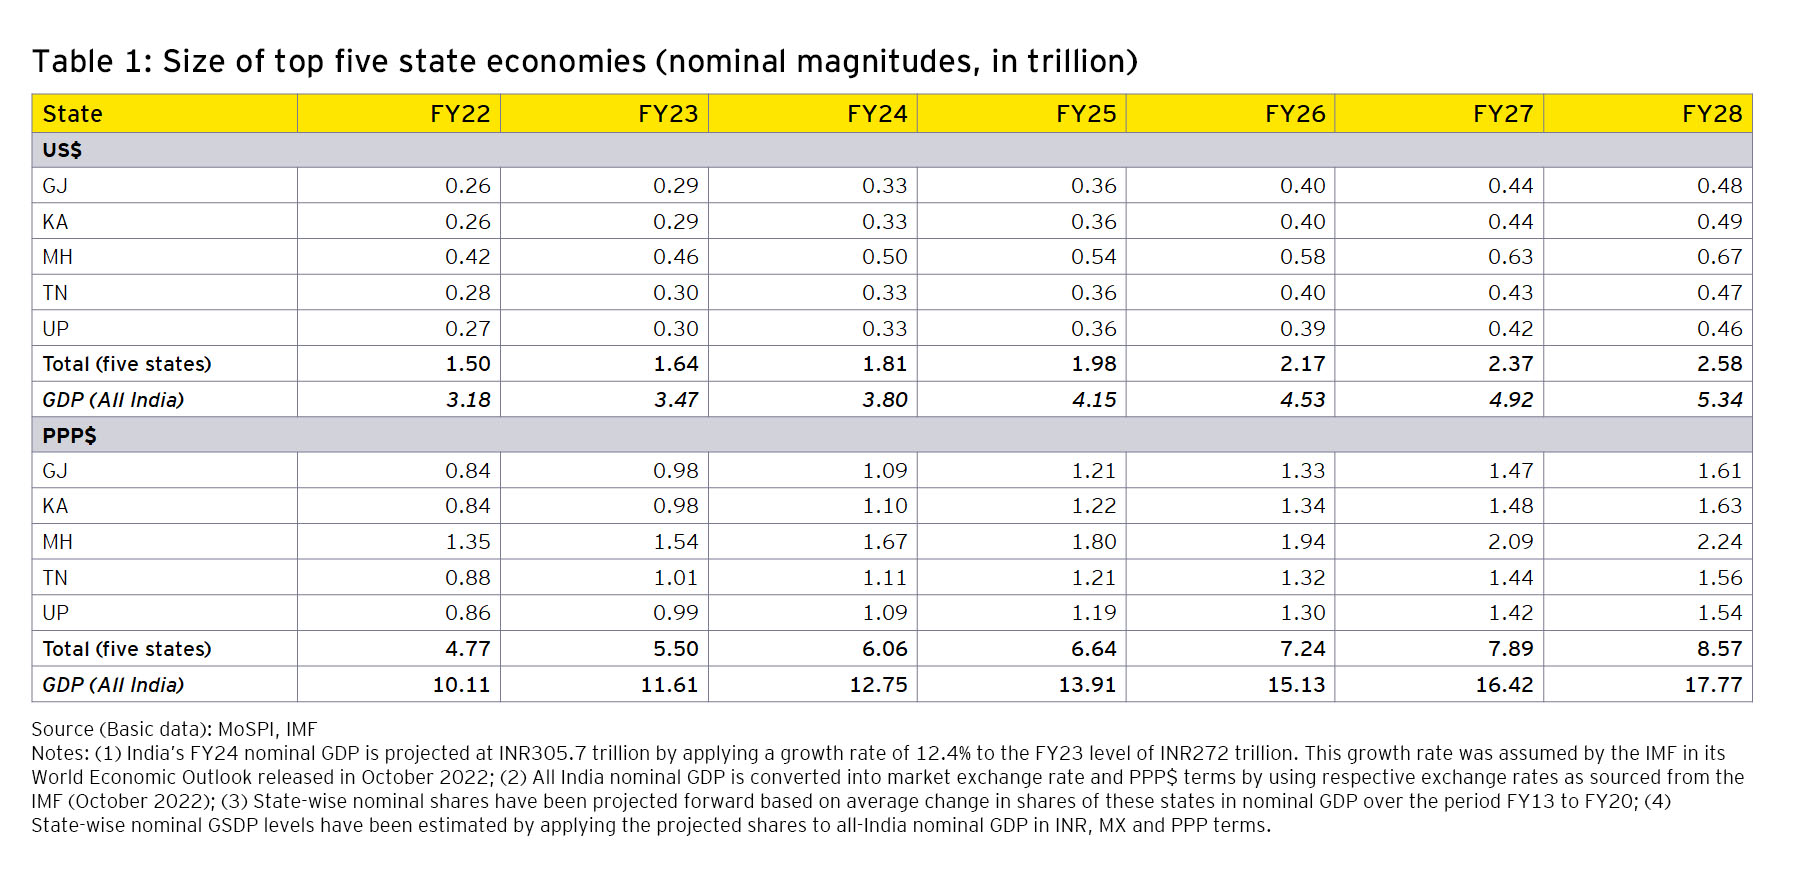
Five states namely Maharashtra (MH), Tamil Nadu (TN), Uttar Pradesh (UP), Gujarat (GJ), and Karnataka (KA) may be identified as the largest in terms of their size as measured by their share in nominal GDP. Table 1 shows the projected size of these state economies in both market exchange rate (MX) terms and PPP terms. 

The estimation methodology utilizes the projections of India’s GDP in nominal terms used in our India@100 report. In this exercise, assumptions relating to Simulation 3 (S3) of the report have been used. Projections under S3 have been modified to some extent by utilizing the latest NSO data pertaining to the nominal GDP numbers for FY21, FY22 and FY23. These have led to a marginal revision in the base numbers. The projection period for this exercise covers seven years from FY22 to FY28 as state-wise gross state domestic product (GSDP) data are available only up to FY21 on a comprehensive basis, although GDP data have become available up to FY23. The methodology consists of first projecting a profile of state wise shares in nominal GDP and then applying these shares to the projected GSDP up to FY28. 

projected size of these state economies in both market exchange rate (MX) terms and PPP terms.

Among the five states, MH is projected to be the highest GSDP state in both MX and PPP terms. It is notable that none of these five states is likely to reach a US$1 trillion level by FY28 in MX terms. Since these five states are projected to reach a combined size of US$2.6 trillion, we would need the contribution of a few more states for enabling the India to reach the US$5 trillion economy target. The next set of states in this sequence are West Bengal, Rajasthan, Andhra Pradesh, Telangana, Madhya Pradesh, and Kerala.  

However, in PPP terms, each of these five economies are projected to have a size larger than $1 trillion by FY24. In fact, MH had already crossed the PPP$1 trillion benchmark way back in FY17. TN is estimated to cross PPP$1 trillion in FY23. The remaining three states would reach a level very close to each other ranging from PPP$0.98 trillion to PPP$0.99 trillion in FY23. All of these are on the verge of crossing the PPP$1 trillion benchmark which, based on present trends, is estimated to happen in FY24. However, together, these five states are estimated to account for a size higher than PPP$5 trillion in FY23. 

Economic and demographic features

Structure of output

Chart 1 shows that the structure of the output is noticeably different across these five states. Considering the average sectoral shares for the pre-COVID-19 period of FY18 to FY20, it is seen that the share of agriculture in GVA has been the highest for UP at 21.4%. The share of services in these economies, excluding GJ, has ranged from 49% to 64%. In GJ’s case, the share of services was 36% whereas that of industry was high at 50%. This is due to the high share of a selected set of industries, including petroleum refineries, petrochemicals, drugs and pharmaceuticals, textiles and cement and ceramics, in its output structure. GJ is also an export-oriented economy, contributing to India’s growth through a growth in net exports.

The structure of sectoral shares has a bearing on the overall GSVA/GSDP growth. States with a relatively larger share of agriculture are expected to experience lower growth, since the average growth in agriculture has been relatively lower than that of industry and services. Between industry and services, the average all-state growth in industry during FY13 to FY20 was comparatively lower at 6.1% as compared to 7.5% for services. Thus, states with a relatively higher share of services initially are likely to experience a continuing increase in the share of services. However, GJ is an exception to this expectation, as discussed above.

Population trends

There are noticeable differences in the population growth trends across these five states. Over the period FY19 to FY21, UP has shown an average population growth which is more than three times that in TN (Chart 2). GJ, MH and KA also have a higher rate of population growth. In general, states with a high population growth would experience a growing share of its working age population. This will have a bearing on the way the demographic dividend unfolds in these states in due course. 

Fiscal trends: capital expenditures of state governments

The economic performance of a state depends, among other factors, to a significant extent on the size of the state public finances and the fiscal policies followed by the state government. Table 2 shows that among the top five states, UP has allocated a higher priority for capital expenditures, which accounted for 3.6% of GSDP on average during FY18 to FY20. On the other hand, MH has provided for a lower share of capital expenditures relative to GSDP. Thus, in the case of GJ and MH, the private sector has played a relatively important part whereas in the case of UP, government intervention in the economy has been quite significant.

Capital expenditures as percentage of GSDP

Show resources

Summary

State governments need to consciously undertake measures to increase their capital expenditure and ensure that most of their fiscal deficit is used for capital expenditures. Alongside, they need to progressively increase the share of services and industry in their GSVA relative to agriculture, which would help expand overall output and enable job creation. 

About this article

By D. K. Srivastava

EY India Chief Policy Advisor

A noted economist, D.K. Srivastava is an Honorary Professor at Madras School of Economics and Member of the Advisory Council to the 15th Finance Commission.

Related topics Tax COVID-19