EY Cash Management

Top US bank holding companies’ treasury services report major recovery


EY US 39th Annual Cash Management Services Survey findings reflect a historic 9.0% cash revenue gain, the largest increase in two decades.


  • Leading US bank holding company treasury services reversed a 6.5% decline from pandemic lows in cash revenue, which is forecast to reach industry highs in 2022.
  • The largest banks surveyed that were most negatively impacted by the downturn strongly rebounded, with an 8.0% increase in cash revenue.
  • Purchasing card revenue made a remarkable recovery from pandemic lows, representing 38% of total recognized revenue, an increase of 27%.

For the 39th year, the Cash Management practice of Ernst & Young LLP (EY US) has conducted a comprehensive survey of US treasury services businesses at top US bank holding companies. With participation by 47 banks, including 80% of the top 20 and 72% of the top 50, the Annual Cash Management Services Survey is considered the barometer for measuring the health of the treasury solutions industry.

With this year’s survey findings reflecting the treasury community’s success in mitigating the financial effects of the COVID-19 pandemic while also emerging prepared to tackle current and future economic headwinds, the phrase “the comeback is always greater than the setback” could not be more accurate in describing the industry’s resilience, initiative, and revenue growth during the last 12 months.

Top findings from this year’s survey include the following:

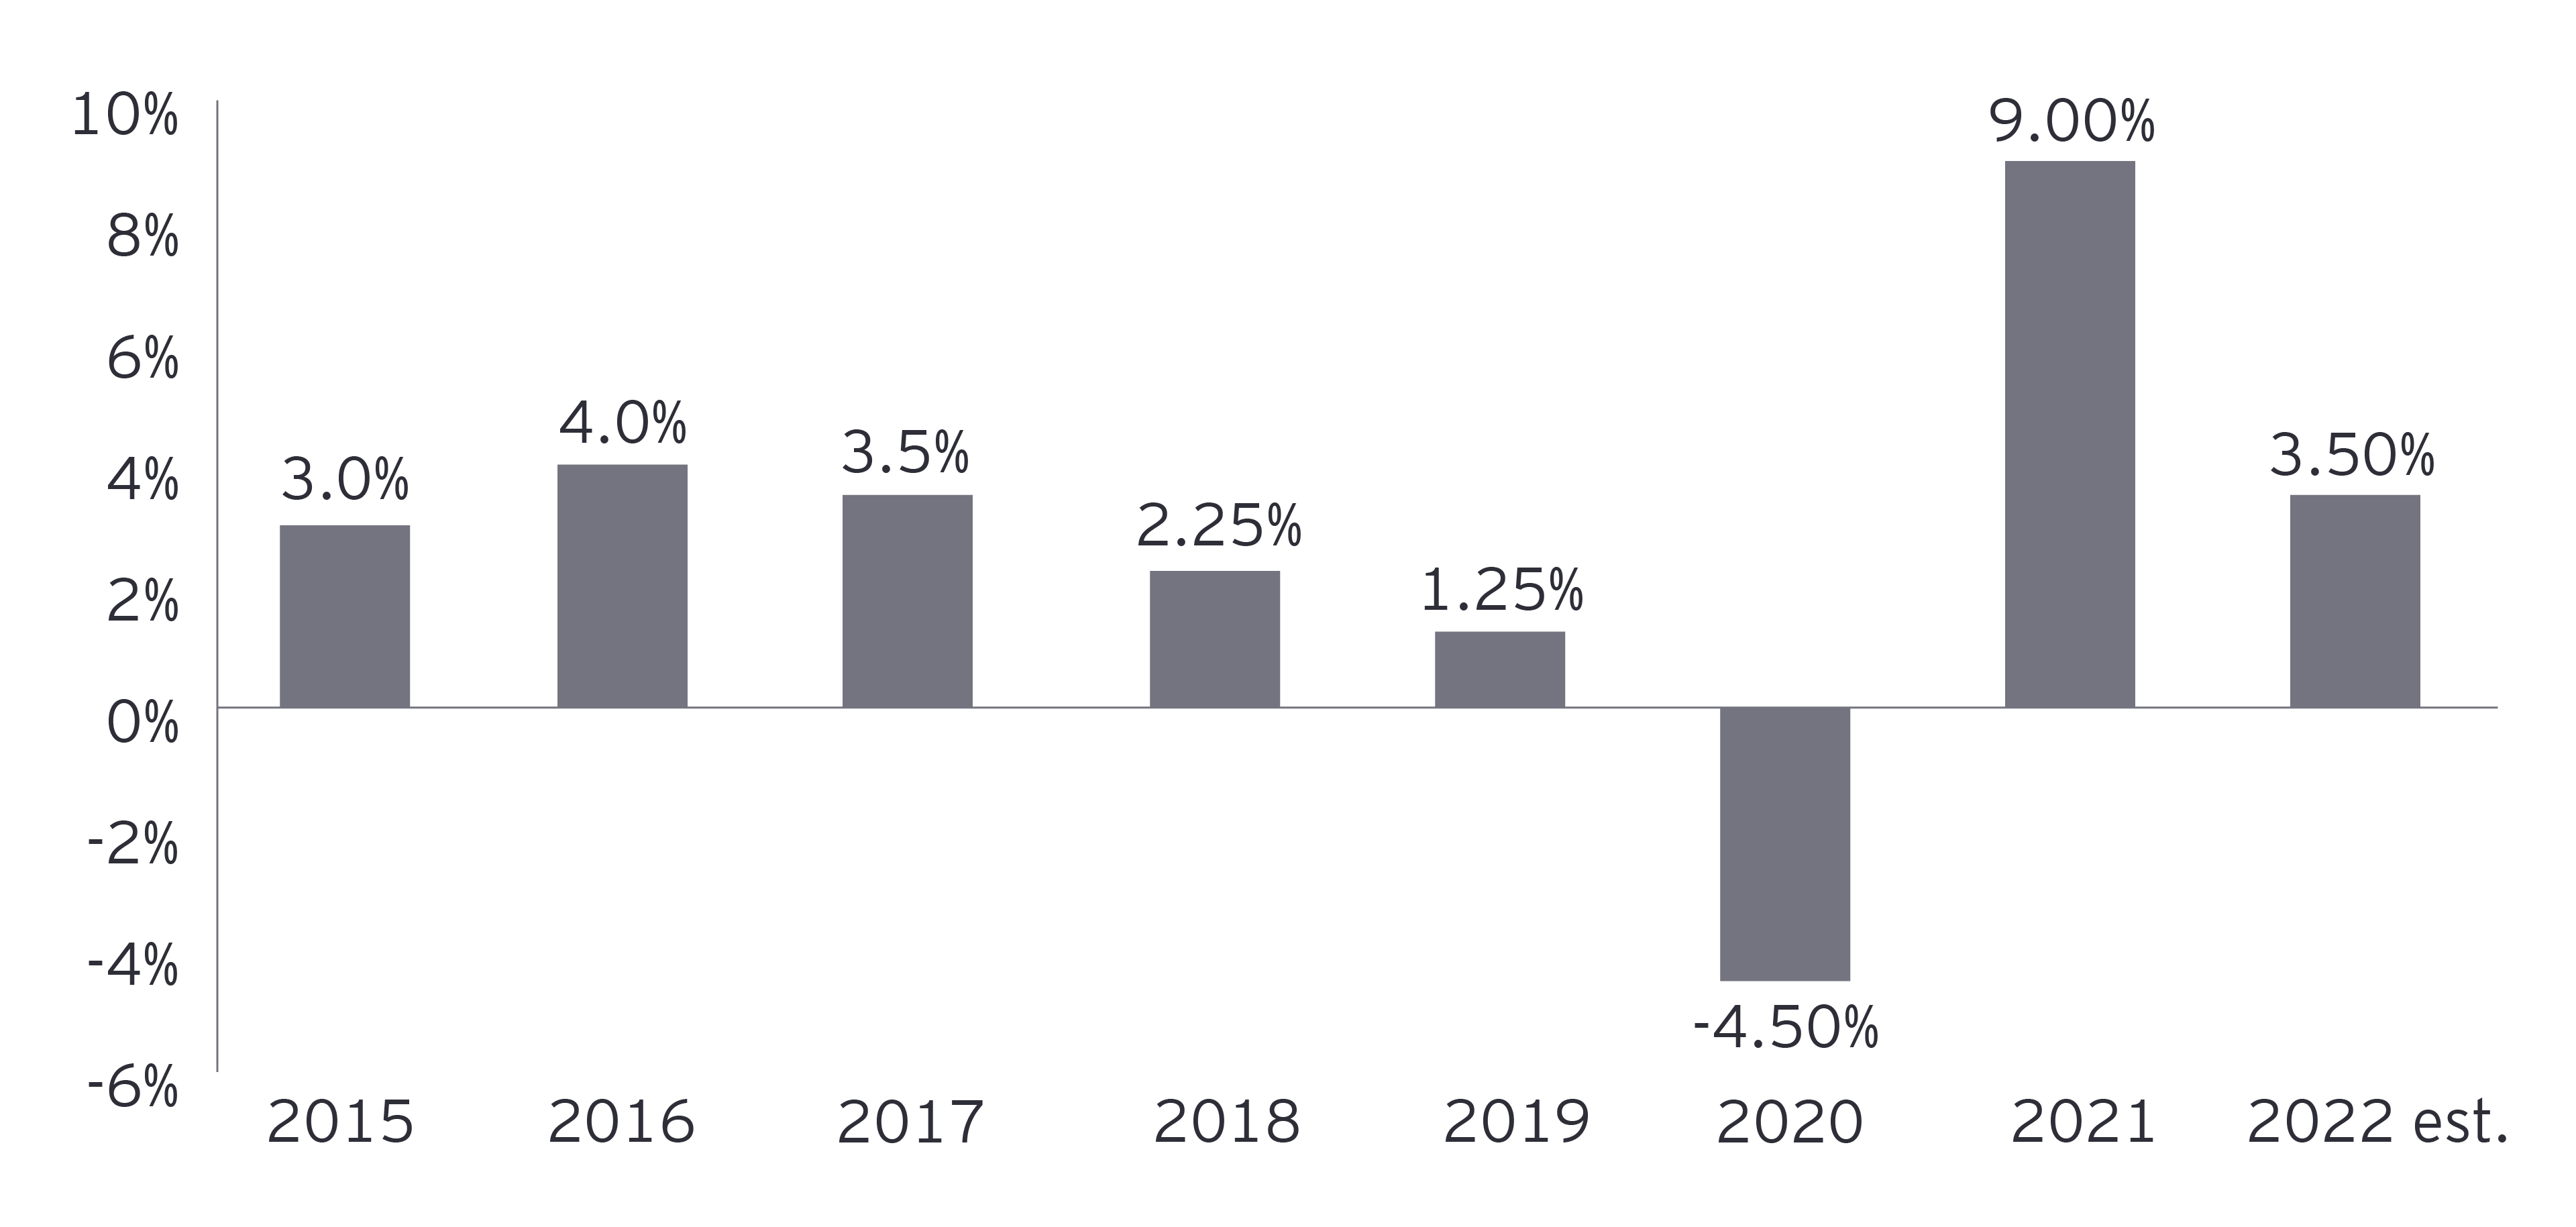
  • Despite last year’s record 4.5% decline in cash management revenue, the industry has made a remarkable recovery, with a 9.0% increase, the largest in the past two decades, and has demonstrated strong fundamental growth across the product suite.
  • There’s been consistent growth across peer groups, with the largest banks most adversely impacted by the pandemic-induced downturn strongly rebounding this past year.
  • But government programs, inflationary factors and supply chain disruptions have had an impact:
    • The benefits of government programs that provided tax credits, loans and loss mitigation to small businesses, large corporations and almost all industries during the pandemic are still working their way through the overall economy due to the timing of the assistance.
    • Inflation has continued to increase at levels well above the expectations of policymakers.
    • Supply chain disruptions and global geopolitical developments are increasing volatility and uncertainty for corporate treasurers and consumers alike. 
    • New and emerging product revenue growth is becoming a larger share of revenue.
  • The future impact of increases in interest rates, inflationary costs and pricing pressures are shaping cash management strategy going forward.
  • Purchasing card revenue, which suffered the second-largest percentage decline in 2020 behind retail lockbox, rebounded dramatically, representing approximately 38.0% of total recognized revenue.
  • Robust growth is realized by electronic products, including wire transfer and information reporting, while the largest revenue decline in dollar terms was demand deposit accounts (DDAs), with revenue falling by US$116m and industry outflows.

Total fee-equivalent revenue is rising to record levels

Treasury’s role in managing the repercussions of the pandemic on cash, liquidity and risk has been very effective, as the 9.0% growth calculated for 2021 increased fee-equivalent revenue to approximately US$19.3b. If the respondent forecast for a 3.5% increase in 2022 is achieved, total fee-equivalent revenue for the top 100 banks will increase to about US$20b, an industry-high watermark as measured by our survey.

Fee-equivalent cash management growth

Fee-equivalent cash management growth


Bank segments exhibit consistent growth

The consistent growth across bank peer groups can be illustrated by our estimate that revenue increased 8.0% in 2021 among the five banks with the highest revenue totals, more than reversing the 6.5% decline realized by the top five banks in 2020. Cash revenue from the other 15 banks in peer group 1 increased by 10.0% in 2021 vs. a 4.0% decline in 2020. The recovered gains can be attributed to increases in purchasing card revenue among the top 20 banks.

Fee-equivalent cash management growth

Fee-equivalent revenue growth by bank segment


Fee-equivalent cash management growth

2022 Bank peer segment profile 


Revenue segmentation remains comparatively unchanged

Compared with last year’s survey findings, revenue segmentation remained relatively unchanged from 2020, with the top five cash management providers contributing 56.0% of the revenue and the other 15 banks in peer group 1 also remaining constant from the previous year with 27.0% of revenue. Peer groups 2 and 3 accounted for the remaining 17.0%.

Fee-equivalent cash management growth

Fee-equivalent revenue by bank segment


Customer group revenue contributions

This year’s survey findings revealed that middle-market firms (US$50m to US$250m in sales) delivered the largest revenue share (37%), followed by large corporates (over US$250m in sales) at 24.0%, with small businesses (less than US$50m) accounting for 20.0%. Financial institutions (other banks, thrifts and credit unions) and the government and nonprofit sector were the smallest segments, responsible for 10.0% and 9.0% of revenue, respectively. By focusing on specific industries and customer segments, many participants have garnered concentrated contributions.

Fee-equivalent cash management growth

Share of 2021 fee-equivalent revenue by customer segment


Product line observations

Emerging from the pandemic, the banking industry is in a much healthier place as evidenced by eight of the 12 electronic-related products that we track in the survey having generated revenue growth in 2021 — almost completely reversing the revenue declines we witnessed in 2020. Robust growth was realized by purchasing card revenue — which suffered the second-largest percentage decline in 2020 due to pandemic-inspired declining corporate spending on travel and entertainment — dramatically rebounding to represent approximately 38.0% of total recognized revenue, an increase of 27.0%. Double-digit growth (15.5%) was also reported for information reporting, with wire and wholesale lockbox both up 10.5%, and coin and currency up 10.0%. Single-digit growth included automated clearing house/electronic data interchange (ACH/EDI) revenue at 6.5%, account reconciliation at 4.0% and retail lockbox at 3.5%.

On the other hand, a few products reflected a revenue decline. DDAs had the steepest fall, losing 3.0% of their revenue. This may be due to the rise in interest rates, with deposit alternatives and the cost of liquidity having both increased, as well as the compensation needed to attract and retain balances also rising. Following the decline in DDAs, controlled disbursement accounts (CDAs) and checks declined by 2.5% and 2.0%, respectively, but this was a largely expected result, given the trends for these products and the decreasing utilization of these services by corporate treasurers.

Fee-equivalent cash management growth

Rates of cash management revenue growth by product


Product line revenue shares hold steady

Of the 2021 fee-equivalent revenue contributions for the product lines included in the survey, proportionally, wire transfers steadily rose to a 20.0% share from 19.5% in 2020, while purchasing cards remained unchanged at 15.0% and DDAs held steady with 14.5% of total cash management revenue.

The next three products in descending order remained static, with share percentages similar to our 2020 findings: ACH/EDI (12.5%), information reporting (11.5%) and wholesale lockbox (10.5%).

Fee-equivalent cash management growth

Cash management revenue by product


Perception of and interaction with FinTechs

The pandemic’s restrictions and lockdowns accelerated transformation of consumer electronic transactions, giving the opportunity for FinTechs to provide financial services in unique ways with a technology-enabled focus on their respective customers. Since the beginning of our FinTech-related topical focus in the survey, we’ve seen an evolution in how banks perceive and interact with FinTechs. Our 2020 survey findings revealed that the top 20 banks polled viewed FinTechs as customers, with the majority actively targeting FinTechs. Outside the top 20, however, the percentage declined rapidly, with only 25% of the smaller institutions reporting having FinTech clients. But in 2021, even the smaller banks shifted from a defensive position to creating unique structures and relationships geared to harnessing the power of FinTechs both in partnerships and as new lines of service. In addition to embracing technology disrupters like FinTechs, banks are viewing technology as a “need to have” instead of a “nice to have,” driving differentiation, seamless end-to-end customer experiences and continued migration toward instant payments. Real-time payments, virtual accounts and the use of application programming interfaces (APIs) are also on the rise, with greater widespread adoption across participating banks.

Summary

The treasury services industry has effectively recovered from COVID-19 pandemic-induced lows to report a record cash revenue gain of 9.0%. Electronic products exhibited strong growth, with purchasing card revenue increasing by 27%, while demand deposit accounts (DDAs) presented the largest revenue decline at 3.0%.

About this article

Related articles

How to enable banking as a service via anti-money laundering programs

A thoughtful operating model between banks and their partners can mitigate the inherent money laundering risks. Learn more.

22 Feb 2023 Don Johnson

If transformation needs to be bold, do banks have the right tools for success?

EY discussions with banking transformation leaders across the globe uncover six recommendations for overhauling organizational change. Learn more.

10 Jan 2023 Jan Bellens + 4

How banks can align collateral functions to a services-based model

Not aligning collateral functions to a services-based model puts banks at greater risk for operational challenges. Learn more.

13 Feb 2022 Jim Capuano + 2