Massive container cargo ship on the ocean, Aerial view of cargo ship at the port.

Tariffs explained: your macro questions answered

The US$1.4t tariff warning raises questions on trade policy, inflation and growth. What are the economic risks? How might businesses respond?


In brief
  • New tariffs on China, Canada and Mexico could impact US$1.4t in trade, raising costs and reshaping supply chains.
  • Autos, electronics, food and energy face the biggest challenges from these tariffs, but nearly every sector is exposed to rising trade tensions.
  • Retaliation and central bank responses will be key to determining the economic fallout and future policy shifts.

What tariffs have been announced, which have been suspended, and which have been implemented?

On February 1, 2025, President Donald Trump signed three executive orders implementing a new tariff policy, imposing a 25% duty on merchandise imports from Mexico and Canada — impacting nearly US$900b in trade — alongside a 10% tariff on Chinese imports. In total, these tariffs affected approximately US$1.4t in imports, accounting for over 40% of total US imports and roughly 5% of US GDP. 

The executive orders included an exemption for Canadian energy resources, subject to a reduced 10% tariff. Additionally, the policy ended the “de minimis” exemption for low-value shipments worth less than US$800, meaning small consumer goods and business imports would be subject to tariffs. 

The tariffs were set to take effect on February 4, 2025, but following conversations between Trump, Mexican President Claudia Sheinbaum and Canadian Prime Minister Justin Trudeau, the US administration agreed to a pause of at least 30 days in the implementation of the duties.

The tariffs on China went into effect as scheduled on February 4.

Why did the US administration announce these tariffs on Mexico, Canada and China?

The broad scope of these tariffs reflects the administration’s focus on managing immigration flows at the southern border and combating drug trafficking while also serving as a strategic positioning tool ahead of the 2026 review of the United States-Mexico-Canada Agreement (USMCA). Overall, the administration sees tariffs as a tool to address multiple issues including trade deficits, reshoring manufacturing activity and generating revenues to help offset the cost of tax cuts and spending initiatives.


This move aligns with the directives set forth in the America First Trade Policy Memorandum, which mandates a series of trade-related assessments by April 1, 2025. These include evaluations of the US trade deficit, unfair trade practices, currency manipulation and China’s adherence to the 2020 Phase 1 trade deal. The memorandum further calls for a review of bilateral and sector-specific trade agreements as well as an examination of former President Joe Biden’s regulations affecting outbound investment and connected vehicle technology.

What is the historical context for these tariffs?

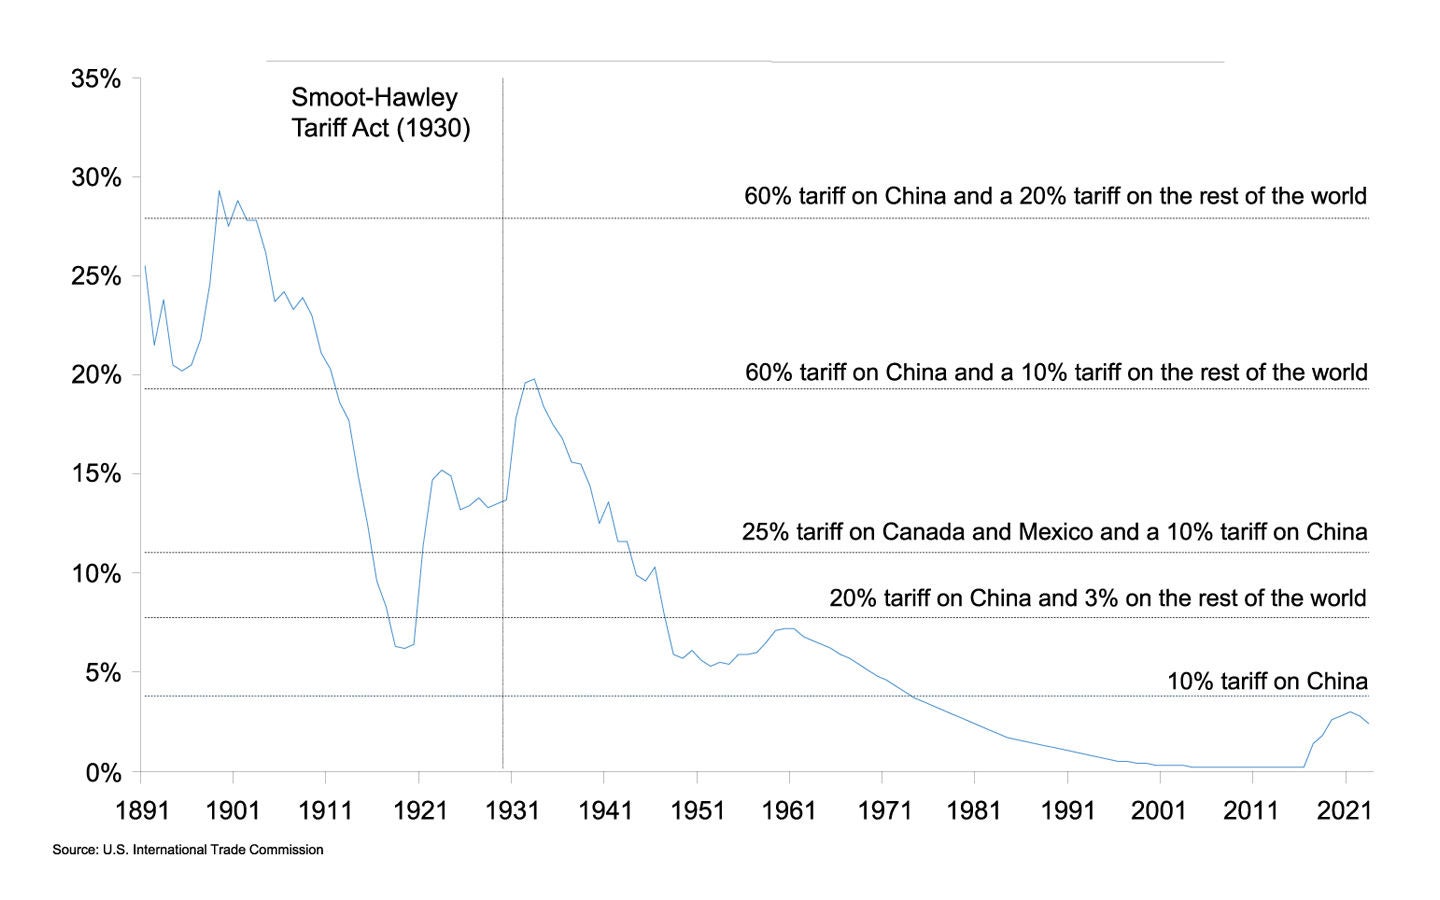
While the US maintained an average import tariff rate of 1% from the early 2000s through 2017, these doubled to about 3% in 2018. The 25% tariffs on all imports from Mexico and Canada along with 10% tariffs on China would have brought the average tariff rate to 11% — a level last seen in the 1940s.


Instead, the 10% tariffs on imports from China have raised the average US tariffs rate to 4%.


Average US tariff rates (%, 1891 – 2023)

EY average us tariff rates chart

How do these China tariffs differ from the 2018 trade conflict?

The 2018 tariffs on China largely targeted intermediate goods — industrial inputs used in US manufacturing — minimizing direct inflationary impacts on consumers. In contrast, the 2025 tariffs focus more heavily on finished consumer goods, including electronics, apparel and household products, making higher retail prices for American households more likely. 

The end of the de minimis exemption — which previously allowed low-value shipments to enter the US tariff-free — further amplifies the impact, reducing avenues for cost avoidance for consumers and increasing compliance burdens for retailers.

What mechanism was used to impose the tariffs?

Trump invoked the International Emergency Economic Powers Act (IEEPA), the National Emergencies Act, and Sections 301 and 604 of the Trade Act of 1974.

The IEEPA in particular gives the president the authority to regulate commerce after declaring a national emergency if they believe there is an “unusual and extraordinary threat” to the US’ national security, foreign policy or economy. 

President Richard Nixon levied a 10% across-the-board tariff on imports in August 1971 to force other countries to revalue their currencies against the dollar — using the Trading with the Enemy Act of 1917. But no prior president has used the IEEPA to impose tariffs on trading partners. Trump threatened to use the IEEPA to impose tariffs on Mexico during his first term, but he did not follow through as Mexico agreed to reinforce border security.

Why would Canadian energy exports have been subject to a reduced 10% tariff?

With no readily available short-term alternatives for Canadian oil and gas, imposing steep tariffs would be economically counterproductive. By opting for a 10% tariff rather than 25%, the administration is likely aiming to balance its stated policy with inflation concerns — ensuring a trade barrier is in place while mitigating the risk of domestic price surges.

Is retaliation in a trade conflict optimal? And is it likely?

Trade retaliation is a complex paradox. While economic theory suggests that refraining from countermeasures is often the best approach — since retaliatory tariffs ultimately raise costs for domestic consumers and businesses — political and strategic considerations frequently dictate a different course.

After the initial announcement of US tariffs, Canada announced a 25% tariff on CA$155b worth of US goods, with an initial CA$30b in tariffs taking effect on February 4, 2025, and the remainder implemented gradually. These measures targeting key US exports, including agricultural products such as dairy, fresh vegetables, fruits and processed foods along with alcoholic beverages and a broad range of consumer goods, such as household appliances, clothing, footwear, furniture and sports equipment, were also suspended for a month. Mexico had signaled its intent to impose retaliatory tariffs, though details weren’t disclosed. 

Meanwhile, China’s Ministry of Finance has adopted a measured and targeted response, announcing that it would levy a 15% tariff starting February 10 on certain types of coal and liquefied natural gas and a 10% tariff on crude oil, agricultural machinery, large-displacement cars and pickup trucks. These would represent about US$15b, or 10% of Chinese imports from the US.

What can we gauge from the 30-day suspension of tariffs against Mexico and Canada?

The suspension of tariffs against Mexico and Canada stemmed from their agreement to enhance border security and tackle drug trafficking. This underscores the transactional nature of Trump’s approach to trade policy, with Trump seeking to leverage other countries’ economic reliance on the US. 

Strategically, this appears to reflect a common negotiation tactic — applying short-term pressure to accelerate policy actions. However, the rapid reversal could introduce a risk: while the initial threat appeared credible, pulling back so quickly may signal that such measures are more about temporary leverage than lasting enforcement. Paradoxically, if trading partners begin to view these tactics as short-lived pressure plays, they may adapt by delaying responses or calling future bluffs. This, in turn, could increase the likelihood of tariffs actually being implemented in future disputes if apparent concessions are not made.

What is the economic impact of the tariffs on China?

A scenario in which Trump imposes 10% tariffs on all imports from China for a full year and assumes retaliation against 10% of US exports along with a 2% US dollar appreciation vs. the renminbi: 

US GDP would be reduced by 0.2% in 2025 and 0.2% in 2026 relative to our baseline as higher import costs dampen consumer spending and business investment. Inflation would rise by 0.1% relative to our baseline in 2025. We anticipate the Fed would not change its stance relative to our baseline in this scenario.

China’s economy would experience a similar hit with GDP falling by less than 0.1% in 2025 and 0.2% in 2026 relative to our baseline. Inflation would rise by 0.2 percentage point (ppt) relative to our baseline in 2025. The People’s Bank of China (PboC) would likely favor a modest 2% depreciation of the yuan to partially offset the hit from tariffs.

What would have been the macroeconomic consequences of sweeping duties against Mexico, Canada and China?

We have stressed that steep tariff increases against US trading partners could create a stagflationary shock — a negative economic hit combined with an inflationary impulse — while also triggering financial market volatility. 

A scenario in which Trump imposes 25% tariffs on Mexico and Canada along with 10% tariffs on China in Q1 and assumes proportional retaliation against US exports can have the following effects: 

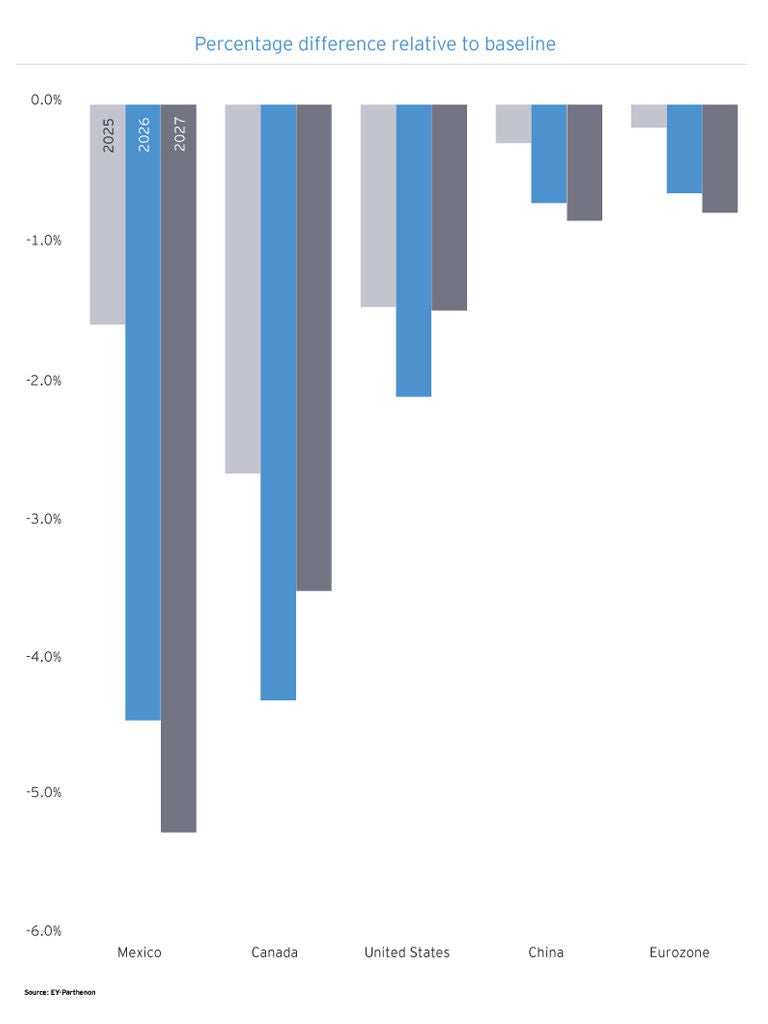
  • US GDP would contract by 1.5% in 2025 and 2.1% in 2026 relative to our baseline as higher import costs dampen consumer spending and business investment. Inflation would rise by 0.7ppt relative to our baseline in Q1 2025 and average 0.4ppt for the year, before gradually easing as demand destruction and a stronger dollar offset price pressures. We estimate that disposable income would be US$137b lower than in the baseline in 2026, representing an average loss of US$1,040 per household, with an uneven distribution across households. For households in the top income quintile, the tariffs would be equivalent to a tax increase of US$350 while the equivalent tax burden for households in the bottom quintile would likely be much larger around US$1,560.
  • Mexico’s economy would shrink by 1.6% in 2025 and 4.5% in 2026 relative to our baseline, with inflation rising by nearly 2ppt above baseline due to a weaker peso and higher import costs.
  • Canada’s economy would shrink by 2.7% in 2025 and 4.3% in 2026 relative to our baseline, with inflation spiking nearly 2ppt above baseline due to trade disruptions and a depreciated Canadian dollar.
  • China’s economy would experience a smaller hit, with GDP falling by 0.3% in 2025 and 0.7% in 2026 relative to our baseline.
  • Spillover effects from this trade conflict would likely reduce the European Union’s GDP by 0.2% in 2025 and 0.5% in 2026, relatively to our baseline, while reducing Japan’s GDP only marginally less. Global GDP would likely be reduced by 0.5% in 2025 and 1.0% in 2026 relative to our baseline.

Impact of Mexico/Canada/China tariff scenario on real GDP level

US 2025 global economic outlook chart

Looking at trade with China, Mexico and Canada, which sectors are most exposed?

For China, electronics — including computers and other electronic products — represent the largest category of US imports and will face notable cost increases under the 10% tariff. Electrical equipment and appliances, a critical input for US businesses, will also see price pressures. Other highly impacted sectors include apparel and accessories, plastics and rubber products, and industrial machinery. Given China’s dominant role in supplying these goods, price hikes are expected to ripple through supply chains, increasing costs for manufacturers and consumers alike.

For Mexico, transportation equipment — particularly automobiles and auto parts — accounts for the largest share of US imports, making the sector a key focus of trade dynamics. Computers and electronics are also a major import category, highlighting Mexico’s growing role in technology manufacturing. Other significant sectors include oil and gas, agricultural products, machinery, and fabricated metal products.

For Canada, oil and gas lead US imports, while transportation equipment — including vehicles and auto parts — serves as a key pillar of North American manufacturing connectivity. Key industrial inputs such as primary metals, chemicals, machinery and petroleum products also feature prominently in bilateral trade.

What does the end of the de minimis exemption entail?

The de minimis tariff exemption allows shipments bound for American businesses and consumers valued under US$800 (per person, per day) to enter the US free of duty and taxes. In 2023, U.S. Customs and Border Protection estimated a total of over 1 billion such shipments worth around US$54b entered the US. 

While the total value of these shipments is modest compared to total US imports of over US$3t, EY-Parthenon research suggests that the elimination of the de minimis exemption would lead to a reduction in aggregate welfare around US$12b, disproportionately hurting lower-income and minority consumers. Since roughly US$18b of de minimis shipments came from China, mostly via e-commerce platforms, we estimate the loss of welfare from eliminating the China exemption to represent around US$4b.

How are central banks likely to react?

Central banks are likely to take varied approaches in response to the economic fallout from tariffs, balancing inflation risks with growth concerns. In economies where the underlying economic fundamentals are weaker and inflation is already close to, or rapidly converging toward targets, central banks may favor easing policy to offset the demand destruction from tariffs. In others, where economic activity is more resilient, inflation is more persistent, and foreign exchange rate pass-through risk is exacerbating inflationary pressures, central banks may be more circumspect in easing policy — favoring a tighter stance to prevent inflation from rising excessively or becoming entrenched.

How did financial markets react?

Financial markets exhibited immediate volatility following the tariff announcements, reflecting investor concerns about trade disruptions, inflationary pressures and potential economic slowdown. The US dollar initially strengthened, sending the Mexican peso and Canadian dollar to multiyear lows, but those moves were largely reversed after the announcement of the 30-day pause.

Equity markets initially sold off, with the S&P 500 dropping 2.0% as investors recalibrated earnings expectations for industries with high exposure to trade with Mexico, Canada and China. Technology and consumer goods stocks, particularly those reliant on Chinese imports, faced sharper declines due to anticipated cost increases. However, a partial rebound occurred after the 30-day suspension of tariffs on Mexico and Canada was announced, alleviating fears of an immediate supply chain disruption. 

In the bond market, Treasury yields initially spiked as investors priced in the inflationary effects of tariffs, with the 10-year yield rising 10 bps. Expectations of Federal policy adjustments also shifted — with some traders anticipating the Fed might remain on hold longer to counteract inflationary pressures. These market moves were rapidly unwound with the announcement of the month-long pause in tariffs. The Fed, in its January meeting, acknowledged the potential inflationary effects of new trade restrictions but maintained a wait-and-see approach, emphasizing data dependency in its policy outlook. 

We should stress that, even in the absence of significant tariffs, a rise in trade policy uncertainty and a resulting tightening in financial conditions would be detrimental to economic activity.

Summary 

The Mexico, Canada and China tariff orders signed by Trump could impact more than 40% of US imports if fully implemented. Electronics, oil and gas, and transportation equipment could all be affected. Central banks are likely to take varied approaches to the tariffs balancing inflation risks with growth concern.

About this article